Solution: Clean Water Discussion
4. Monte Carlo Simulation
We can also use one of the Excel Add-ins mentioned earlier to conduct a Monte Carlo Simulation. The major advantage of that procedure is that we are not limited to a small number of scenarios and that, in principle, we could simultaneously change a large number of assumptions.
What follows simply illustrates one possible implementation of such a simulation. A detailed discussion of Monte Carlo Simulation using Microsoft Excel goes beyond the scope of this course. Note that the websites of the various providers offer excellent tutorials and case studies.
To conduct our simulation of Clean Water's financial plan, let's assume the following. For simplicity, we limit the analysis to three potential value drivers:
- The annual growth in sales growth from geographic expansion (50 in the base case) is somewhere between 0 and 100 (triangular distribution)
- The personnel expenses (25% in the base case) are somewhere between 23% and 27% (triangular distribution)
- The reorgaization costs during the first year (200 in the base case) are somewhere between 150 and 250 (triangular distribution).
With this information, we can now start the simulation in Excel. Intuitively, this works as follows:
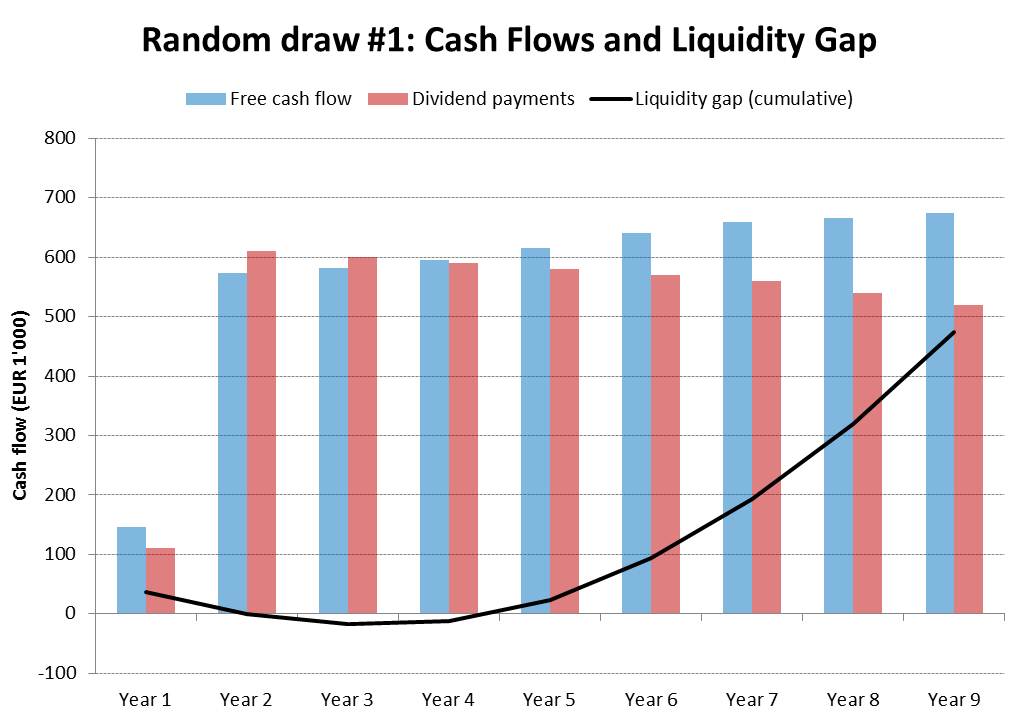
- Excel picks randomly a number from the above distributions. For example, the random draw could be:
- Annual growth in sales growth: 30 (20 lower than expected)
- Personnel expenses: 24% (1% lower than expected)
- Reorganization costs: 220 (20 higher than expected)
- Excel then plugs these numbers in the financial plan and records the outcome. In this particular case, the outcome would be that the firm would be able to make the necessary dividend payments without by borrowing a maximum of 18'000 in Year 3.

- There is a very high probability that the firm will not generate sufficient funds to pay the necessary dividends.
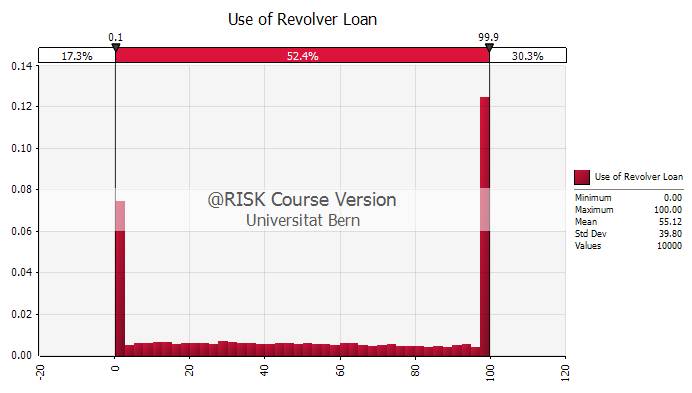
- As shown in the following graph, only in 17.3% of all cases can the free cash flow cover these dividends. In 82.7% of all simulated cases, the firm will need additional funding.
- In many instances, the available credit line from the revolver loan is sufficient to bridge the additional cash needs. However, there is a 30.3% probability that the credit line will be too small and the firm will have to raise additional capital, most likely in the form of equity.

Additional funding requirements
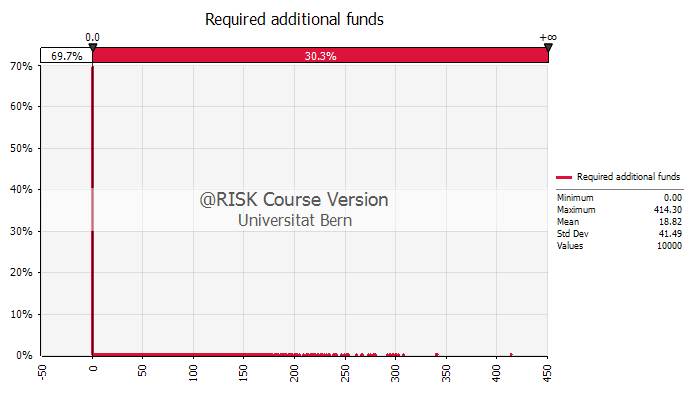
- The following chart takes a closer look at the additional funding requirements. Consistent with the previous chart, there is a 69.7% probability [=1 - 0.303] that the firm will need to raise additional capital.
- From today's perspective, the owner has to expect that an additional equity contribution of 18'820 will be needed.
- This implies that, IF the firm needs additional equity (in 30.3% of all cases), the expected equity contribution is approximately 62'000 [= 18'800/0.303].
- The graph also shows (though it is hard to see) that the required additional equity contribution can be as large as 400'000 (with a very low probability).

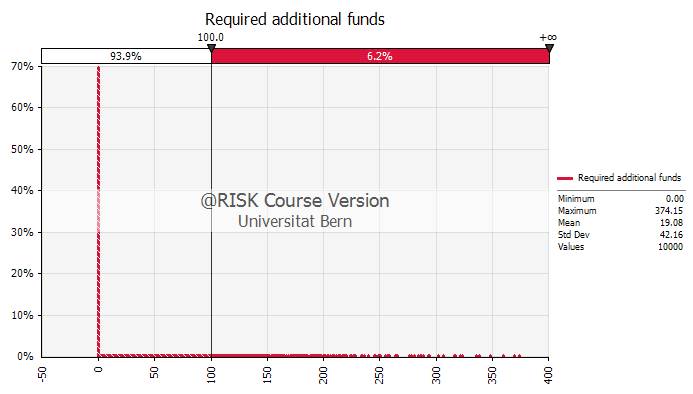
- We can adjust the graph to get additional valuable information. Suppose, for example, that the buyer knows that when push comes to shove his mother in law could support him with EUR 100'000. How contingency plan will save the firm's existence?
- As the following graph shows, there is a rather low probability that the firm will need more than 100'000 in additional equity. Our simulation implies that this is the case in only 6.2% of all cases.
- With this contingency plan at hand, the probability is fairly high (approximately 94%) that the buyer will be able to make the debt payments as scheduled.

Summary
This section has briefly illustrated the use simulation software in financial planning. Properly applied, the resulting framework constitutes a very powerful management tool.
Still, a word of caution might be appropriate: The quality of the simulation analysis depends on the quality of our distribution assumptions for the value drivers. If these assumptions are flawed, the conclusions we draw from the analysis will most likely also be flawed. Therefore, these fascinating tools do not absolve us from thinking through the business plan in a careful and critical way and from investing time and energy to come up with reasonable assumptions.