Reading: Liquidity Ratios
3. Hershey Application
Let's have a look at Hershey's liquidity. For the computation of the ratios, we focus on the business year 2015 and express all values in millions. From the balance sheets, we know the following:
- Cash: 346.5
- Accounts receivable: 599.1
- Current assets: 1'848.6
- Current liabilities: 2'217.9
With this information, we can now compute Hershey's liquidity ratios for 2015:
Current ratio = \( \frac{\text{Current assets}}{\text{Current liabilities}} = \frac{1'848.6}{2'217.9} \) = 0.83.
Quick ratio = \( \frac{\text{Cash} + \text{Accounts receivable}}{\text{Current liabilities}} \) = \( \frac{346.5+599.1}{2'217.9} \) = 0.43.
Cash ratio = \( \frac{\text{Cash}}{\text{Current liabilities}} \) = \( \frac{346.5}{2'217.9} \) = 0.16.
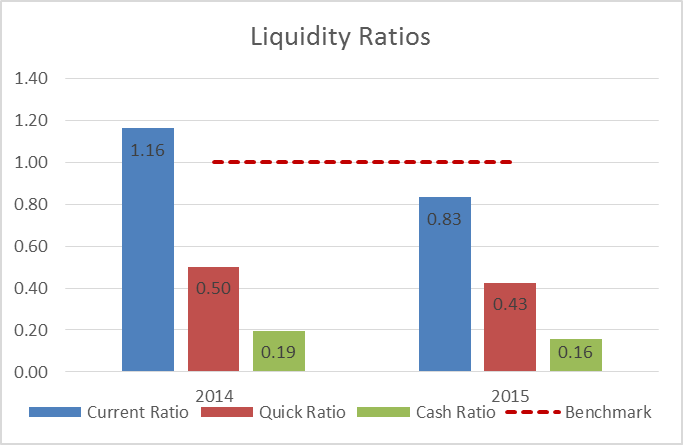
The following graph summarizes the results, along with the corresponding values from 2014:

The chart shows that the firm's liquidity has decreased from 2014 to 2015.
- The current ratio dropped from 1.16 to 0.83. Put differently, the firm's current assets are no longer able to cover its current liabilities. Generally, we would like to see current ratios > 1.
- The cash ratio dropped to 0.16. Note, however, that it is not unusual to see cash ratios that are substantially below 1.
A quick look at other firms in the same industry shows that their liquidity ratios are similar. For example, General Mills has reported a current ratio of 0.77 and a quick ratio of 0.4 in 2015.