Reading: Leverage Ratios
4. Coverage Ratios
The previous sections have shown how to compute debt and leverage ratios. These ratios provide important information about the firm's capital structure.
The third prominent set of financing ratios are the so-called coverage ratios. The purpose of these ratios is to better understand whether the firm's operating business generates sufficient money to make its contractual payments to the debtholders (interest expenses plus repayment of notional).
INTEREST COVERAGE RATIO (ICR)
The interest-coverage ratio. This ratio relates the firm's interest expenses to its EBIT and thereby provides information about the firm's ability to pay interest:
Interest coverage ratio (ICR) = \( \frac{EBIT}{\text{Interest expenses}} \).
The ratio indicates how many times the firm can pay its interest expenses from its operating profit.
- A high interest coverage ratio is an indication of good credit quality, as the firm can well afford its interest payments.
- A low interest coverage ratio, in contrast, indicates poor credit quality. A slight decrease in EBIT might render such a firm unable to pay interest from operating profit.
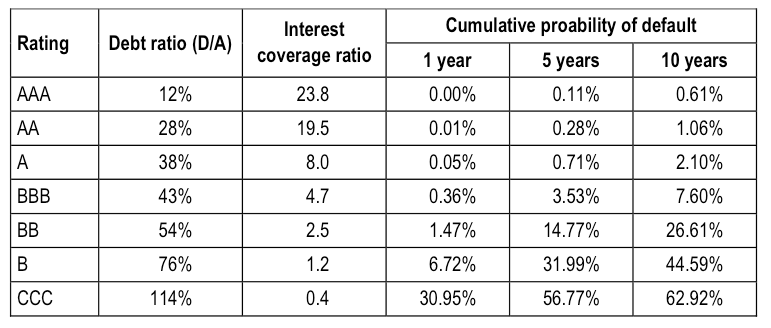
As the following table shows, interest coverage ratios are indeed strongly correlated with the credit ratings. A high ratio indicates good credit quality whereas a low ratio is a sign of poor credit quality. For example, firms with a AA rating have an ICR of 19.5, on average. The probability that such a firm goes bankrupt over the next 10 years is about 1%. In contrast, firms with a B rating have an average ICR of only 1.2. Their 10-year default probability is almost 45%.

To practice, let's quickly compute Hershey's interest coverage ratio in 2015. From its income statement, we know (in millions of USD):
- EBIT 2015: 1'037.8
- Interest expenses 2015: 105.8.
Hence, the firm's interest coverage ratio is approximately 9.8:
Interest coverage ratio (ICR) =\( \frac{EBIT}{\text{Interest expenses}} = \frac{1'037.8}{105.8} \) = 9.8.
Looking at the table above, this coverage ratio implies a debt rating of A. This corresponds to the actual rating that Moody's assigned the firm for a 600-million debt offering in late 2015.
DEBT/EBIT(DA) RATIO
The other important coverage ratio is the so-called Debt-to-EBITDA or Debt-to-EBIT ratio. It is a good indicator of the firm's ability to pay off its debt with its operating profit. Debt generally refers to the firm's financial liabilities. The measure of operating profit is either the firm's EBIT or its EBITDA. We have encountered both measures in the discussion of the income statement.
In the context of debt coverage, the main difference between the two measures is:
- The Debt-to-EBIT factually assumes that the firm makes replacement investments equal to the Depreciation and amortization charges before paying off debt.
- In contrast, the Debt-to-EBITDA ratio facually assumes that the firm repays debt before making any investments.
Therefore, the Debt-to-EBIT ratio is a more conservative measure of the firm's ability to pay off its debt.
Let's look again at Hershey's numbers in 2015. From the firm's balance sheets and income statement we know (in millions of USD):
- Debt (financial liabilities) at the end of 2015: 2'420.5
- EBIT in 2015: 1'037.8
- EBITDA in 2015: 1'563.5
With this information, we can now compute the relevant ratios:
Debt-to-EBIT ratio =\( \frac{2'420.5}{1'037.8} \) = 2.33.
Debt-to-EBITDA ratio =\( \frac{2'420.5}{1'563.5} \) = 1.55.
Interpretation:
If EBIT remains the same and if the firm abstains from any investments, it would take Hershey 1.55 years to repay it's debt outstanding, according to the Debt-to-EBITDA ratio. This repayment time is extended to 2.33 years if the firm makes annual replacement investments equal to the current depreciation, amortization, and impairment charges.