Reading: WACC for Listed Firms
So far, we have seen what the WACC is and how we use it in firm valuation. This section takes a brief look at how to estimate the WACC in practice.
2. Estimating the Cost of Equity
2.2. Estimating the Risk-Free Rate
What we need are yields-to-maturity on zero-coupon (pure discount) Government bonds.The assumption, of course, is that the probability of default on those bonds is zero. Current yields-to-maturity on riskless zero bonds (yields on riskless pure discount papers) are also known as current spot rates or current spot yields.They define the so-called term structure of interest rates.
You can think of the spot rates as the rates the market uses to compute the current value of future riskless cash flows. For each maturity, there is generally a different spot rate. Hence, the risk-free rate depends on the maturity we are considering.
Let's have a look at real data. For simplicity, we consider the case of the Swiss company Holcim, one of the world's leading suppliers of cement and aggregates. Suppose we want to estimate its cost of equity as of January 2010. Because Holcim is a Swiss company, all components of the cost of capital estimation have to be expressed in Swiss francs. Therefore, the risk-free rate of return we should use is the yield to maturity of Swiss Government bonds.
The Swiss National Bank publishes these data on its website. The January 2010 data are as follows.
|
Maturity |
Spot rates (%) |
|
1 year |
0.63 |
|
2 years |
0.49 |
|
3 years |
0.74 |
|
4 years |
0.99 |
|
5 years |
1.21 |
|
7 years |
1.60 |
|
8 years |
1.76 |
|
10 years |
2.01 |
|
20 years |
2.40 |
|
30 years |
2.33 |
For firm valuation, we generally use the 10-year spot rate as a proxy for the risk-free rate of return. In our case, we would therefore approximate \( R_F \) with 2.01%.
If this information is not available, one can use the yield-to-maturity on riskless coupon bonds, say Government bonds, or the rates observed in the Euromarket. In either case, this is only an approximation.
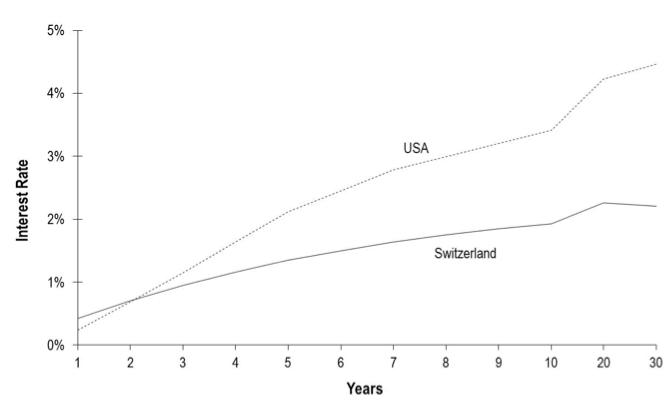
Note that different currencies have different risk-free rates. The following graph illustrates this by plotting the risk-free rates of Switzerland and the United States:

Let's ignore cross-country differences in interest rates for the moment. We will get back to this issue later on.