Reading: WACC for Listed Firms
So far, we have seen what the WACC is and how we use it in firm valuation. This section takes a brief look at how to estimate the WACC in practice.
2. Estimating the Cost of Equity
2.3. Estimating the Market Risk Premium
The estimation of the market risk premium and of the stock's beta is more complicated.
This estimation requires the definition of what we mean by the "market portfolio.” In principle, this is a portfolio of all risky securities in the economy, e.g. real estate, stocks, bonds, precious metals, art objects, human capital, etc. If we had historical data concerning that portfolio, we could compute returns on that portfolio, and then we could use the average difference between those returns and the contemporaneous riskless rates to measure the market risk premium, MRP.
Unfortunately, there are no data about the market portfolio per se, which means we have to find proxies. To estimate the market risk premium in the CAPM, academics suggest using the equity risk premium, namely the difference between the required return on equities and the risk-free rate. The equity risk premium is typically estimated using historical figures, namely the average (mean) difference between the return on equities and the contemporaneous risk-free rate.
For the period 1900-2000, Dimson, Marsh, and Staunton (2002) report historical annual market risk premia for different countries, namely short-term and long-term market risk premia (geometric annual averages). Long term is investment horizons of ten years or longer.
|
Country |
Short-term, annual market risk premium |
Long-term, annual market risk premium |
|
Switzerland |
4.8% |
3.8% |
|
Germany |
3.8% |
5.3% |
|
France |
6.8% |
3.9% |
|
Italy |
6.6% |
4.3% |
|
Japan |
6.7% |
5.9% |
|
Canada |
4.5% |
4.2% |
|
UK |
4.4% |
4.1% |
|
USA |
5.5% |
4.5% |
|
Europe |
4.8% |
4.0% |
|
World |
4.7% |
4.0% |
What we are ultimately interested in is the predicted annualized market risk premium. To compute that premium, Dimson, Marsh, and Staunton recommend the following computation:
Projected volatilities (standard deviations of return) can be obtained from the volatility indices reported in most stock markets. For example, for the U.S., there is the Chicago Board Options Exchange Volatility Index (VIX), which measures the predicted volatility of the S&P 500 Index. Similar indices exist, among other countries, in the UK for the FTSE 100, in Germany for the DAX, and in Switzerland for the SMI. Current data about those indices are reported on various Internet platforms such as Yahoo Finance, OnVista, or on the Web sites of the various exchanges.
The figure below shows the volatility index for the SMI between December 2005 and December 2014. Note that (implied) volatility is in no way constant over time. Whereas its value was mostly below 20 percent in 2006 and 2007, it rose to a peak of over 80 percent in mid-October of 2008 during the financial crisis.

We can use the SMI volatility index (VSMI) to compute the long-term market risk premium with the approach recommended by Dimson, Marsh, and Staunton. At the end of June 2009, for example, the SMI volatility was 22.9%. Using the numbers from the preceding table, we can therefore predict a market risk premium of 6.4 percent, namely:
Long-term CHF market risk premium= \( 0.038 + 0.5 \times 0.229^2 \) = 0.038 + 0.026 = 0.064 = 6.4%.
Alternatively, there are several online sources that provide estimates of market risk premia around the world. Loosely speaking, these sources can be grouped into model-based estimates and survey-based estimates. A short selection of providers is listed below.
Model-based estimates of market risk premia:
Survey-based estimates of market risk premia:
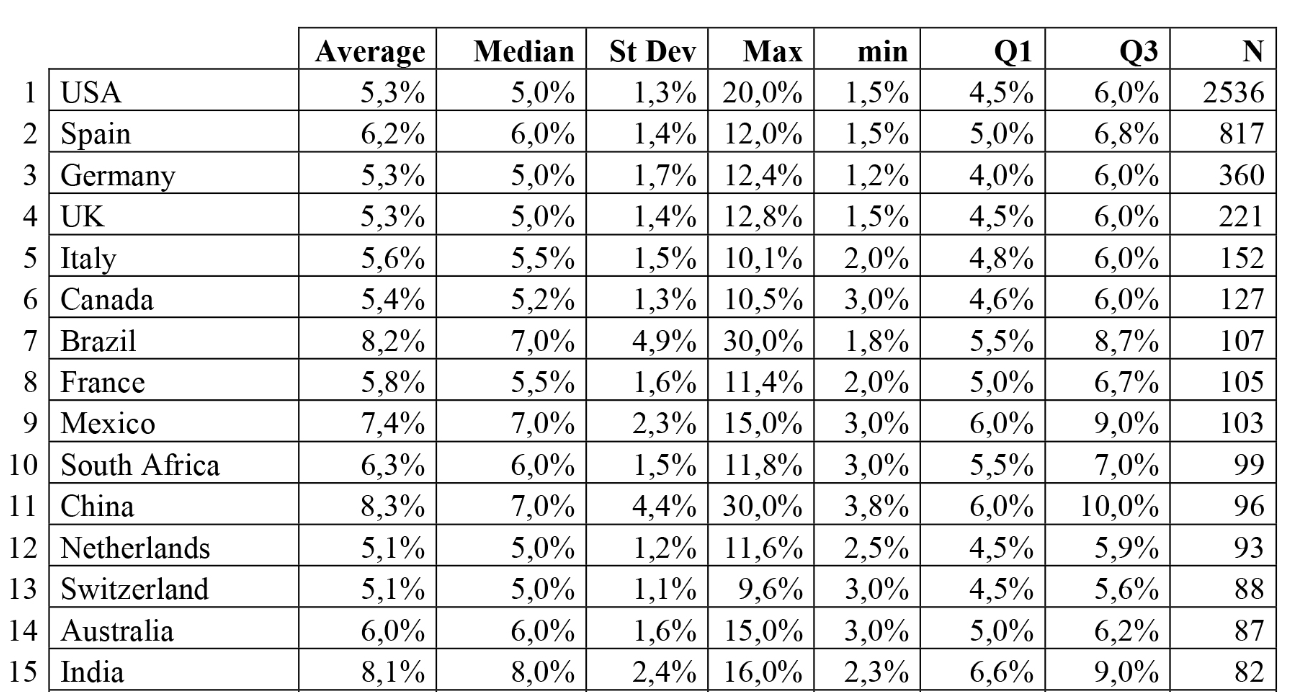
In particular, the latter survey by Fernandez covers a large number of participants from different countries. According to the survey results, the typical (median) market risk premium used in countries with mature industries and relatively low inflation rates such as the U.S., Germany, the U.K., and Switzerland is 5.0%: