Reading: Introduction
This section discusses the crucial issue of how to assess the firm value created after the explicit forecast period.
2. The Market's Time Horizon
To see whether the market assumes a long-term perspective when valuing firms or assets, let us look at a real life example: Novartis, one of the world's largest pharmaceutical companies.
In November 2016, the stock of Novartis was trading at a price of CHF 68. We know that the stock price corresponds to the present value of all expected future dividend payments. Now let's assume the following:
- The last annual dividend paid by the stock was CHF 2.7
- The market expects dividend payments to grow by 1% in the future
- The firm's cost of equity is 5%
- The market applies the Gordon-Shapiro model when setting stock prices, that is, the market assumes that future dividend payments take the form of a growing perpetuity.
With this information at hand, we can actually replicate the firm's stock valuation as of November 2016:
Stock price = \( \frac{Div_0 \times (1+g)}{k_E - g} = \frac{2.7 \times 1.01}{0.05-0.01} \approx 68 \).
But what exactly does this tell us about the market's time horizon? If the market expects the future dividends to grow at 1% and the cost of equity is 5%, we can actually forecast these dividend payments and compute their present value. The following table does this for the next 5 expected dividend payments (years):
|
Expected Dividend |
Present Value @ 5% |
|
|
Dividend 1 |
2.73 |
2.60 |
|
Dividend 2 |
2.75 |
2.50 |
|
Dividend 3 |
2.78 |
2.40 |
|
Dividend 4 |
2.81 |
2.31 |
|
Dividend 5 |
2.84 |
2.22 |
|
Total |
12.03 |
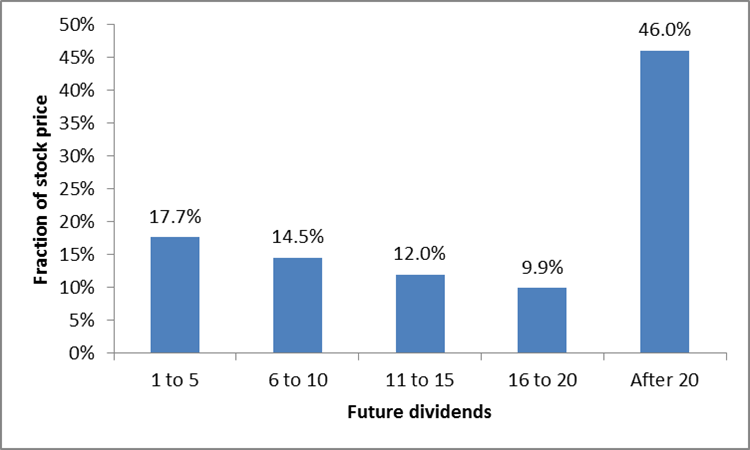
According to the numbers in the table, the cumulative present value of the next 5 dividend payments is 12.03. Therefore, the cash flows the market expects the stock to pay over the next five years only account for 12.03/68 = 17.7% of the stock price! Put differently, more than 80% of the value ascribed to the stock by the market arises from expected cash flows beyond year 5. Clearly, forecasting cash flows for only 5 years will therefore not produce a meaningful valuation!
The following graph replicates the preceeding analysis for a much longer time horizon. The key take-away is that, conditional on the model's assumptions, almost 50% of the stock price result from expected dividends that are more than 20 years in the future!

Clearly, this section shows that the market assumes a (very) long-term perspective when valuing assets. It is therefore crucial to think beyond the "explicit forecast period" and make meaningful assumptions for "continuing value."