Reading: Normalized Projections for Continuing Value
This section discusses the crucial issue of how to assess the firm value created after the explicit forecast period.
3. Value Creation in the Long Run
We have seen that, in the long run, firms can achieve real growth if they invest in new projects with a positive real return (ROIC > Inflation). We have also argued, however, that these new projects only add value if the return they earn exceeds the cost of capital (ROIC > WACC). This implies the following:
- All projects with a ROIC larger than the rate of inflation but smaller than WACC will contribute to real growth but destroy value. Firms should not do these projects and abstain from new investments (p = 0)
- All projects with a ROIC equal to the WACC will contribute to real growth but not affect firm value
- Only projects with a ROIC larger than the WACC create real growth and add value.
The purpose of this section is to provide a simple numerical example that illustrates these points. The firm we are considering has the following characteristics (all normalized values):
- Sales in year 1: 50'000
- EBIT margin (m): 20%
- Tax rate (τ): 20%
- Consequently, the firm's NOPLAT1 is Sales1 × m × (1 - τ) = 50'000 × 0.2 × 0.8 = 8'000
- WACC: 10%
- Inflation (π): 2%
Now let us consider some alternative scenarios for the firm's investment policy in the long run.
Scenario 1: Reinvestment Return (ROIC) equals WACC
In this case, we have argued that new investments generate growth but do not affect value. To see this, let us consider two investment policies: Zero reinvestments (p = 0) and a reinvestment rate of 50%.
1a: Zero reinvestments (p = 0)
Without new investments, the firm will grow at the rate of inflation and generate a FCF equal to NOPLAT:
- Normalized growth g = π + p × (ROIC - π) = π = 2%
- Normalized FCF1 = NOPLAT1 × (1 - p) = NOPLAT = 8'000
Consequently, the value of the firm will be 100'000:
Firm value = \( \frac{\text{Normalized FCF}_1}{WACC-g} = \frac{8'000}{0.1-0.02} \) = 100'000.
1b: 50% reinvestments (p = 0.5)
With new investments, the firm will achieve real growth but earn a lower FCF due to new investments:
- Normalized growth g = π + p × (ROIC - π) = 0.02 + 0.5 × (0.1 - 0.02) = 6%
- Normalized FCF1 = NOPLAT1 × (1 - p) = 8'000 × 0.5 = 4'000
As it turns out, the value of the firm will remain unaffected by this revised investment policy:
Firm value = \( \frac{\text{Normalized FCF}_1}{WACC-g} = \frac{4'000}{0.1-0.06} \) = 100'000.
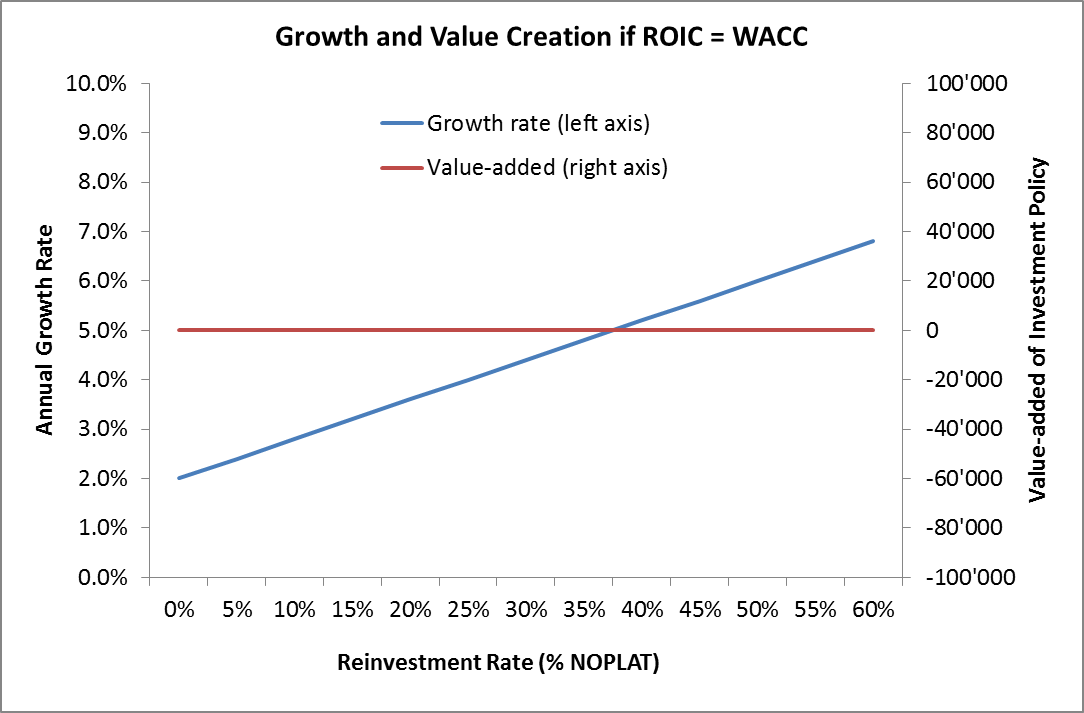
The following graph summarized the the growth rate and value added for different reinvestment policies under scenario that the reinvestment return just equals the cost of capital (ROIC = WACC). The graph shows that the (real) growth rate increases as the firms reinvests more (blue line). However, the value added (compared to a scenario without any new investments, p = 0) is zero. Put differently, firm value does not change (red line).

Scenario 2: Reinvestment Return (ROIC) is larger than the WACC
Now let's assume that the firm can invest in projects that generate a ROIC of 12%, which is larger than the WACC of 10%. In this case, we have argued that new investments generate real growth and add value. To see this, let us consider two investment policies: Zero reinvestments (p = 0) and a reinvestment rate of 50%.
2a: Zero reinvestments (p = 0)
Without new investments, the situation will be the same as in the preceeding section (Scenario 1a): The firm will grow at the rate of inflation and generate a FCF equal to NOPLAT:
- Normalized growth g = π + p × (ROIC - π) = π = 2%
- Normalized FCF1 = NOPLAT1 × (1 - p) = NOPLAT = 8'000
Consequently, the value of the firm will remain at 100'000:
Firm value = \( \frac{\text{Normalized FCF}_1}{WACC-g} = \frac{8'000}{0.1-0.02} \) = 100'000.
1b: 50% reinvestments (p = 0.5)
If the firm engages in new investments, it will achieve real growth but earn a lower FCF due to new investments:
- Normalized growth g = π + p × (ROIC - π) = 0.02 + 0.5 × (0.12 - 0.02) = 7%
- Normalized FCF1 = NOPLAT1 × (1 - p) = 8'000 × 0.5 = 4'000
Becasue of the higher reinvestment return, the firm will grow faster than under the preceeding scenario 1b (7% vs. 6%). The result is a positive impact on firm value:
Firm value = \( \frac{\text{Normalized FCF}_1}{WACC-g} = \frac{4'000}{0.1-0.07} \) = 133'333.
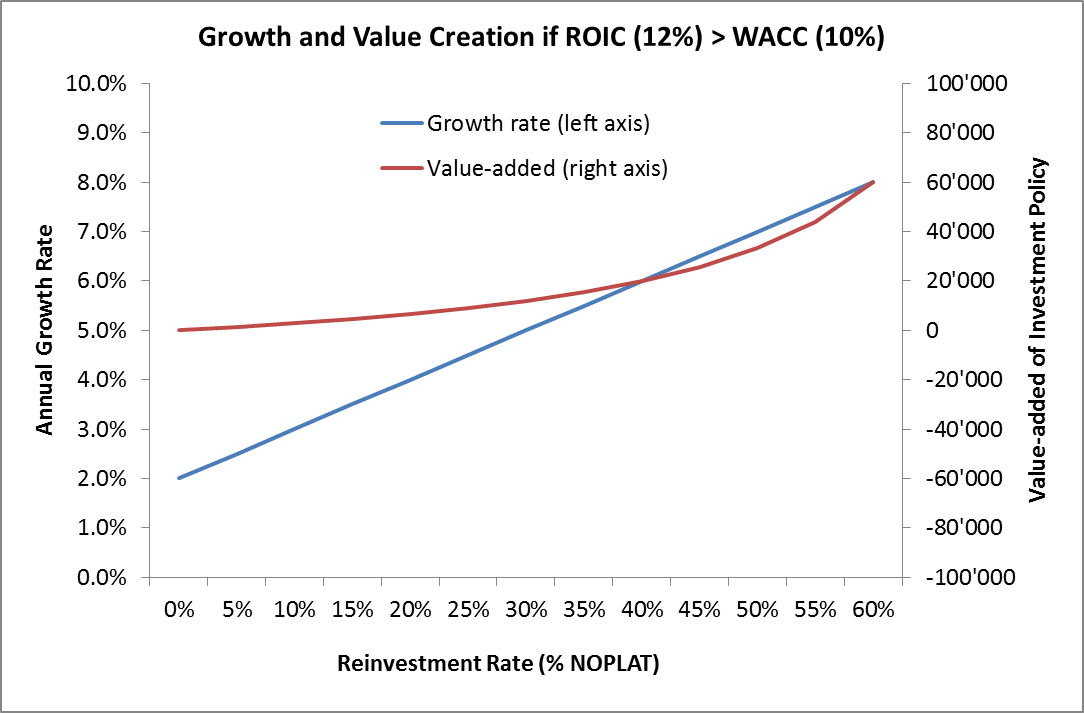
Therefore, the revised investment policy adds a value of 33'333. The following graph summarized the the growth rate and value added for different reinvestment policies under scenario that the ROIC (12%) exceeds the WACC (10%).

Clearly, if new projects generate a positve NPV (ROIC > WACC), higher investments increase firm value. Under this scenario, an investment policy that maximizes growth also maximizes value.
Scenario 3: Reinvestment Return (ROIC) is SMALLER than the WACC
Now let's assume that the firm can invest in projects that generate a ROIC of 8%, which is below the WACC of 10%. In this case, we have argued that new investments generate real growth but destroy value. To see this, let us consider again the two investment policies: Zero reinvestments (p = 0) and a reinvestment rate of 50%.
2a: Zero reinvestments (p = 0)
Without new investments, the situation will be the same as in the preceeding sections (Scenario 1a and 2a): The firm will grow at the rate of inflation and generate a FCF equal to NOPLAT:
- Normalized growth g = π + p × (ROIC - π) = π = 2%
- Normalized FCF1 = NOPLAT1 × (1 - p) = NOPLAT = 8'000
Consequently, the value of the firm will remain at 100'000:
Firm value = \( \frac{\text{Normalized FCF}_1}{WACC-g} = \frac{8'000}{0.1-0.02} \) = 100'000.
1b: 50% reinvestments (p = 0.5)
If the firm engages in new investments, it will achieve real growth but earn a lower FCF due to new investments:
- Normalized growth g = π + p × (ROIC - π) = 0.02 + 0.5 × (0.08 - 0.02) = 5%
- Normalized FCF1 = NOPLAT1 × (1 - p) = 8'000 × 0.5 = 4'000
Becasue of the lower reinvestment return, the firm will grow slower than under the preceeding scenarios 1b and 2b (5% vs. 6% and 7%, respectively). The result is a negative impact on firm value:
Firm value = \( \frac{\text{Normalized FCF}_1}{WACC-g} = \frac{4'000}{0.1-0.05} \) = 80'000.
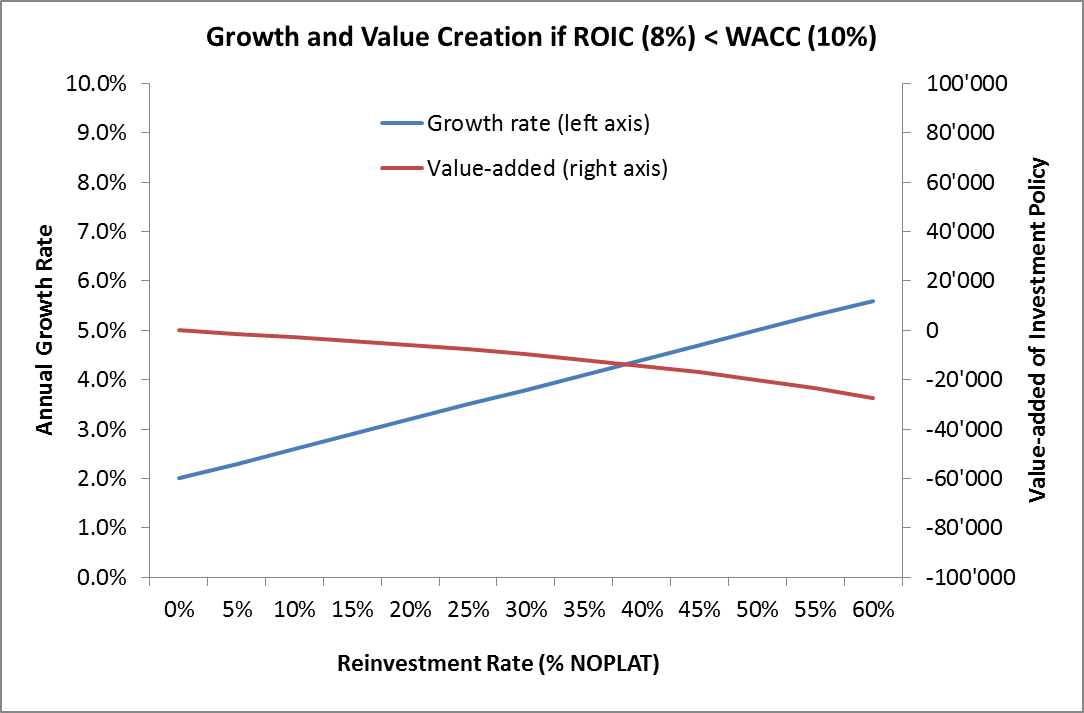
Therefore, the revised investment policy destroys a value of 20'000, even though the firm achieves significant real growth! The following graph summarized the the growth rate and value added for different reinvestment policies under scenario that the ROIC (8%) is smaller than the WACC (10%).

Clearly, if new projects destroy value (ROIC < WACC), higher investments reduce firm value. Under this scenario, an investment policy that maximizes growth is detrimental to firm value!
This section has illustrated that growth and value creation are not necessarily the same. Growth only adds value if the capital it requires is invested at a return (ROIC) that exceeds the cost of capital (WACC). Importantly, the last scenario has shown that higher growth will destroy value if it comes from projects that fail to earn their cost of capital!