Reading: DCF for Startups
4. Handling Additional Risks
4.1. Discounting with Hurdle Rates
The first approach is to add additional risk premiums to the cost of capital when discounting the firm's future cash flows. The magnitude of the risk premium depends on the additional (systematic) risk of the startup firm relative to an investment in the comparable firms that were used to estimate the baseline cost of capital (a WACC of 10%, in our case).
The result is the so-called hurdle rate:
Hurdle rate = Benchmark WACC + Additional risk premium.
To quantify the hurdle rates, we assess the additional sources of risk of the startup for each year of the forecast period, assuming the firm made it that far. For example, we could proceed as follows:
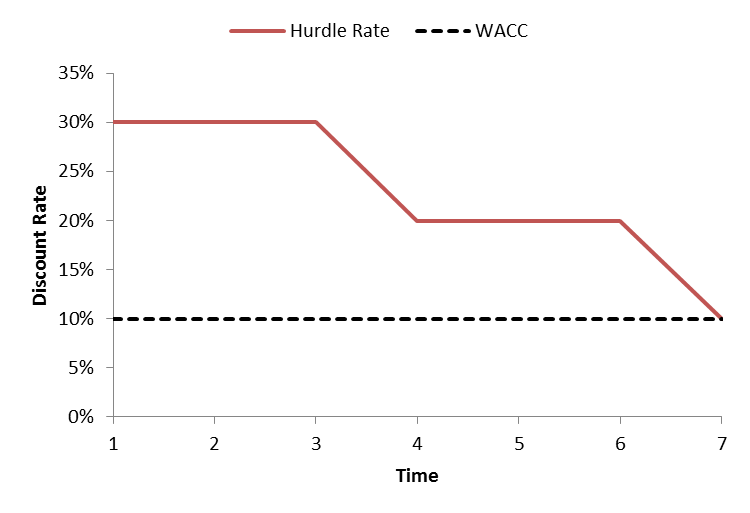
- For the first three years, the additional risks are significant (e.g., access to funding, technical realization, etc.). We assume that these additional risks require a risk premium of 20% on top of the "normal" WACC. Hence, we apply a hurdle rate of 30% for the first three years of all future cash flow streams.
- Assuming the firm makes it past year 3, some of the initial risks will be less pronounced going forward. For example, there could be less uncertainty about the technical realization, better access to funding, and a more reliable business plan after year 3. Let's assume that the reduction in risk after year 3 justifies a risk premium of 10% instead of 20% for the following three years. Consequently, we discount the years 4 to 6 of all future cash flow streams at a hurdle rate of 20%.
- Finally, let's assume that if the firm makes it past year 6, it will become a "normal" company, in the sense that it does not pose any additional systematic risks. Consequently, we assume that the "normal" WACC is the appropriate discount rate for the years 7 onwards of all future cash flows.
The following graph illustrates the assumed hurdle rates over time and compares them to the "normal" WACC of 10%:

It is important to note that we apply the estimated hurdle rates to the respective period of ALL future cash flows.
- For the cash flow of year 4, for example, the discounting occurs at a hurdle rate of 30% for the first 3 years and 20% for the fourth year.
- Similarly, for the cash flow of year 7, the first three years are discounted at 30%, the following three years at 20%, and the remaining seventh year at 10%.
Since a given cash flow will be discounted with multiple discount rates, it is helpful to work with the so-called discount factors rather than the discount rates directly. The discount factor simply indicates the present value of a unit of currency that we expect to collect in the future. Based on our assumptions:
- The discount factor for year 4 is: \( \frac{1}{1.3^3 \times 1.2} = 0.379 \).
Put differently, a dollar the firm is expected to generate in 4 years is currently valued at approximately 38 cents.
- Similarly, the discount factor for year 7 is: \( \frac{1}{1.3^3 \times 1.2^3 \times 1.1} = 0.239 \).
Hence, a dollar the firm is expected to generate in 7 years is currently valued at only 24 cents.
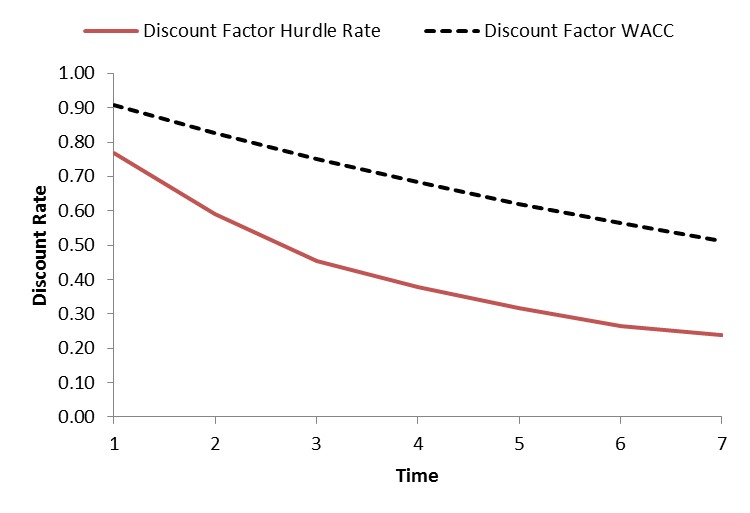
The following graph summarizes the discount factors for the whole forecast period and compares them with the discount factors that would result when using the WACC without additional risk premiums.

The figure clearly shows the "devastating" effect of the hurdle rates on the present values of the future cash flows. Take the case of the last year of the forecast period: As we have already seen, discounting with the hurdle rates implies that a dollar in year 7 is valued at 24 cents today. In contrast, the dashed line shows that the same cash flow would have a value of 51 cents if we valued it at the normal WACC.
Consequently, because the firm in question is a startup with significant additional risks, a promised future cash flow is less than half as valuable as in an established firm that operates in the same business.
We can now use the discount factors for the various forecast years to value the company. The following table shows the result:
| Year 1 | Year 2 | Year 3 | Year 4 | Year 5 | Year 6 | Year 7 | |
| Free Cash Flow | -1'000 | -1'000 | 500 | 1'000 | 2'000 | 3'000 | 5'000 |
| Discount Factor Hurdle Rate | 0.769 | 0.592 | 0.455 | 0.379 | 0.316 | 0.263 | 0.239 |
| PV Cash Flow | -769.2 | -591.7 | 227.6 | 379.3 | 632.2 | 790.2 | 1'197.3 |
After accounting for the additional risk elements, the overall value of the firm (the sum of the individual present values) is therefore 1.866 million.
We can now compare this valuation with the one from the previous section, where we have applied no additional risk premiums to the WACC. That valuation was 4.8 million. Therefore, the value of our startup company is more than 60% lower once we take into account the additional risks of the firm!
Hurdle rates used by professional investors
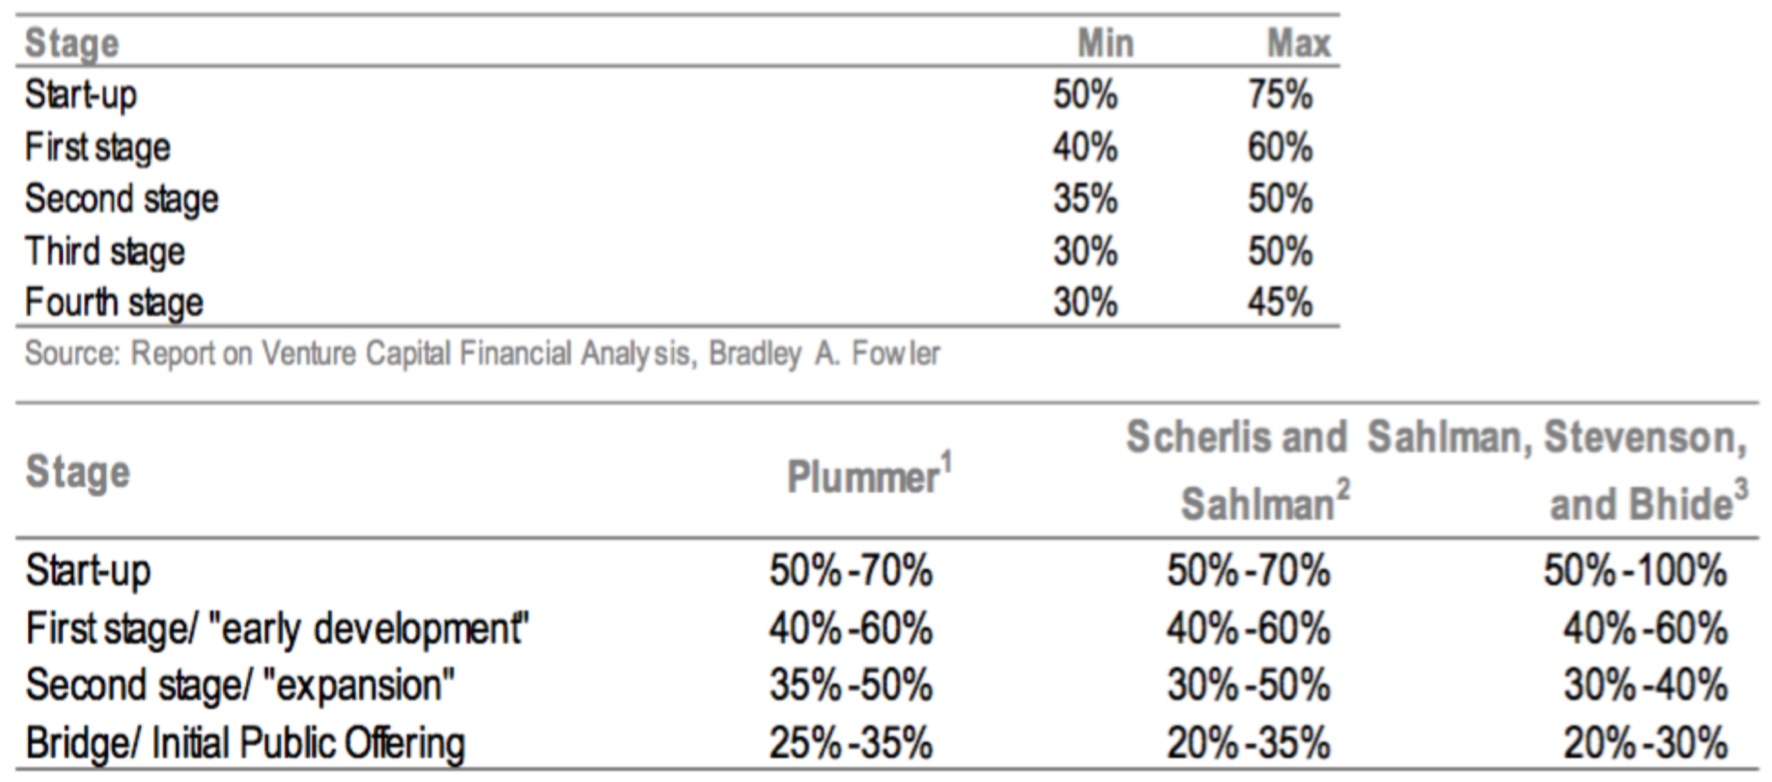
A key implementation issue is the estimation of the appropriate hurdle rate. While it is clear that riskier ventures should carry higher hurdle rates, there is little theoretical guidance for how to estimate them in practice. The following table summarizes "typical" hurdle rates used by professional investors, grouped by the life-cycle stage of the company.

Sources: (1): James L. Plummer (1987); (2) Daniel R. Scherlis and William A. Sahlman (1989); (3) Howard H. Stevenson and Amar V. Bhide (1998)
Summary
This section has shown how we can adjust the cost of capital to incorporate the additional sources of risk that investors face when investing in startup companies. The procedure was to add specific risk premiums to the cost of capital and then use the resulting hurdle rates to discount the expected future cash flows. We have seen that the adjustment for the additional risks of startup companies can have massive value implications. In our particular case, the valuation dropped by more than 60% after incorporating these risks.
A potential challenge of this approach is that the choice of risk premium is somewhat arbitrary. There are no clear guidelines with respect to how the specific sources of risk and their magnitudes translate into risk premiums.