Reading: Introduction
Abschlussbedingungen
Anzeigen
2. The Relevance of Corporate Payout
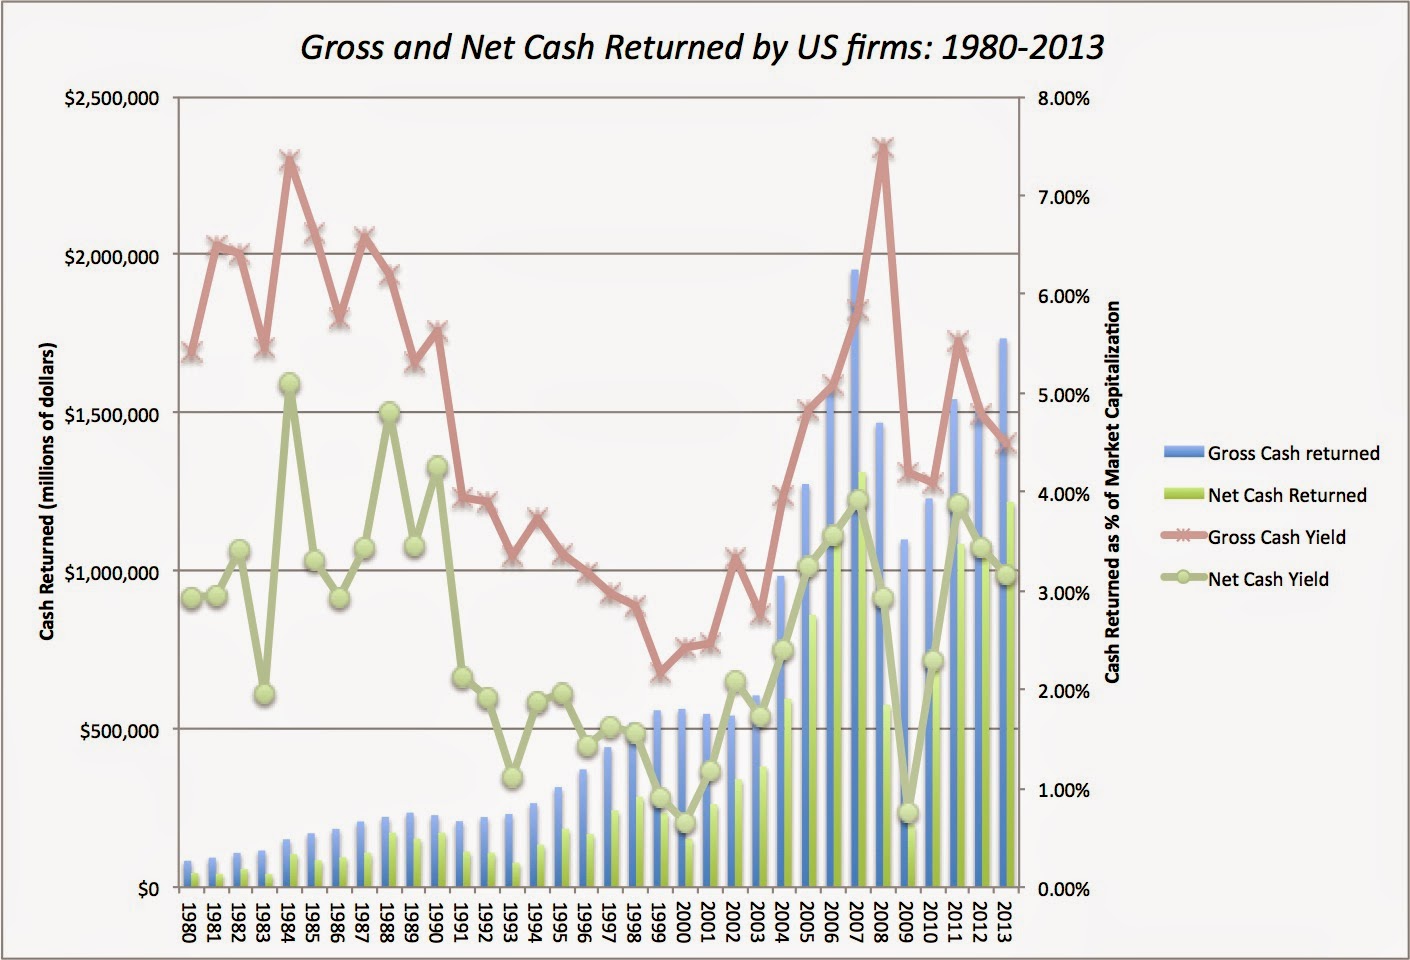
Each year, firms return tremendous amounts of money to their shareholders. The following graph from Damodaran summarizes the cash distributions by U.S. firms over the years 1980 - 2013.
The main takeaways are:
- Total cash returned is more than 1.5 trillion per year (blue bars). This corresponds to roughly 5% of the market capitalization of all listed firms (red line).
- Cash payouts to shareholders dwarf the capital raised from shareholders. The net payout (payout - capital raised) amounts to more than 1 trillion per year (green bars). This corresponds to a cash return of approximately 3% (green line).
- High "dividend" yields: Put differently, the average stock pays a net cash "dividend" of approximately 3% of its value.
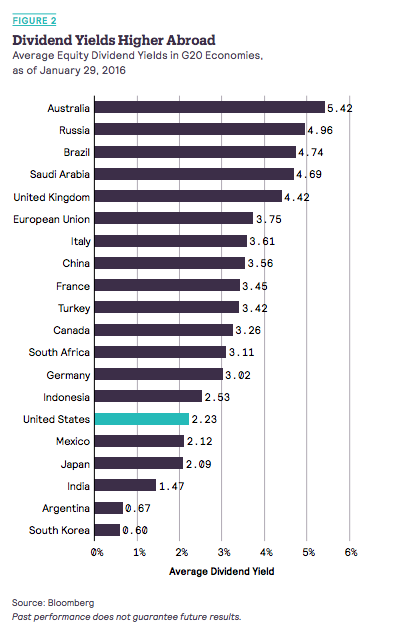
The United States is not the only country with high corporate payout, as the following table (Source: www.dividend.com) shows for a slightly different time period as the previous graph:
Corporate payout decisions are therefore economically important and it is crucial for managers to understand their key characteristics and implications.

