Reading: The Relevance of Payouts
3. Firms' Investment Opportunities
The previous section has shown that the availability of attractive investment opportunities is a key determinant of how aggressively firms should return capital to their investors. In this section, we investigate whether firms, on average, forego (valuable) investment opportunities to meet their shareholders' demand for cash payouts.
To do so, we first look at the overall investment activity of firms over time and then ask how many valuable investment opportunities (mature) firms actually have, on average.
Capital investment over time
If (excessive) payout leads to underinvestment, one would expect to observe that firms have scaled down their investment activities to meet shareholders' demands for cash.
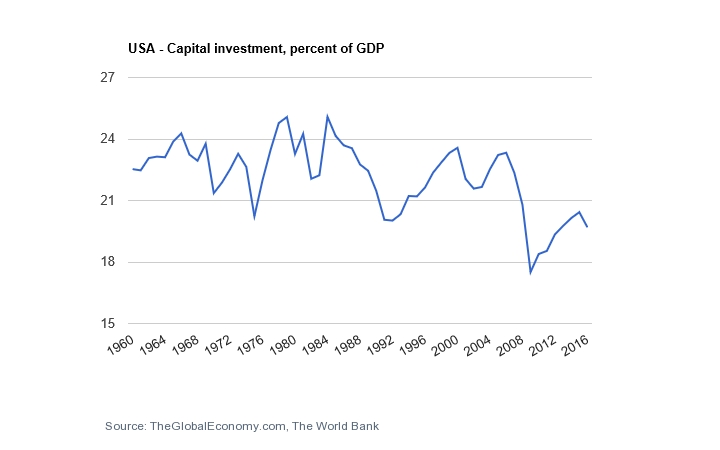
The following graph shows the total capital investments of firms as a percentage of GDP for the U.S. over the period 1960 to 2016. There indeed seem to be a trend that firms invest less, as the ratio has dropped from approximately 23% in 1960 to approximately 20% in 2016:
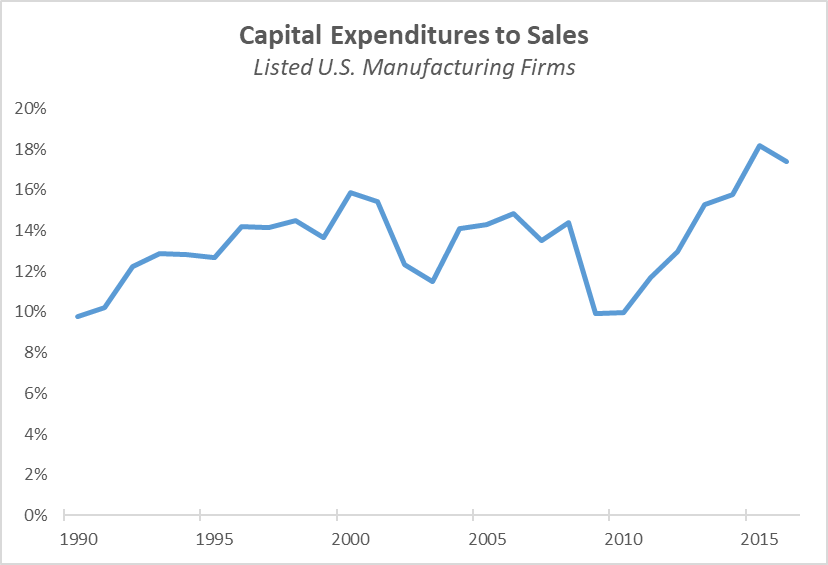
However, it could also be that the U.S. economy, in general, has become less capital intense, as weight has shifted from the secondary sector (manufacturing) into the tertiary sector (services). In support of this view, the following graph looks at manufacturing firms only and shows the ratio of capital expenditures to sales over the period 1990 to 2016. It does not look as if manufacturing firms have scaled down their investment activities during that time. Therefore, the claim that firms, in general, underinvest because of the shareholders' liquidity needs is difficult to square with the results from this graph.
The Availability of Valuable Investment Opportunities
Payouts are mostly a phenomenon of mature firms. The question therefore is whether these mature firms, on average, succeed at finding valuable new investment opportunities to replace their aging products and services. Loderer, Stulz, and Waelchli (2017) study this question in a large sample of listed U.S. firms. The following graph summarizes their main finding: It shows how growth opportunities (as measured by the market-to-book ratio of the firm's assets, the so-called Tobin's q) evolves as firms grow older.
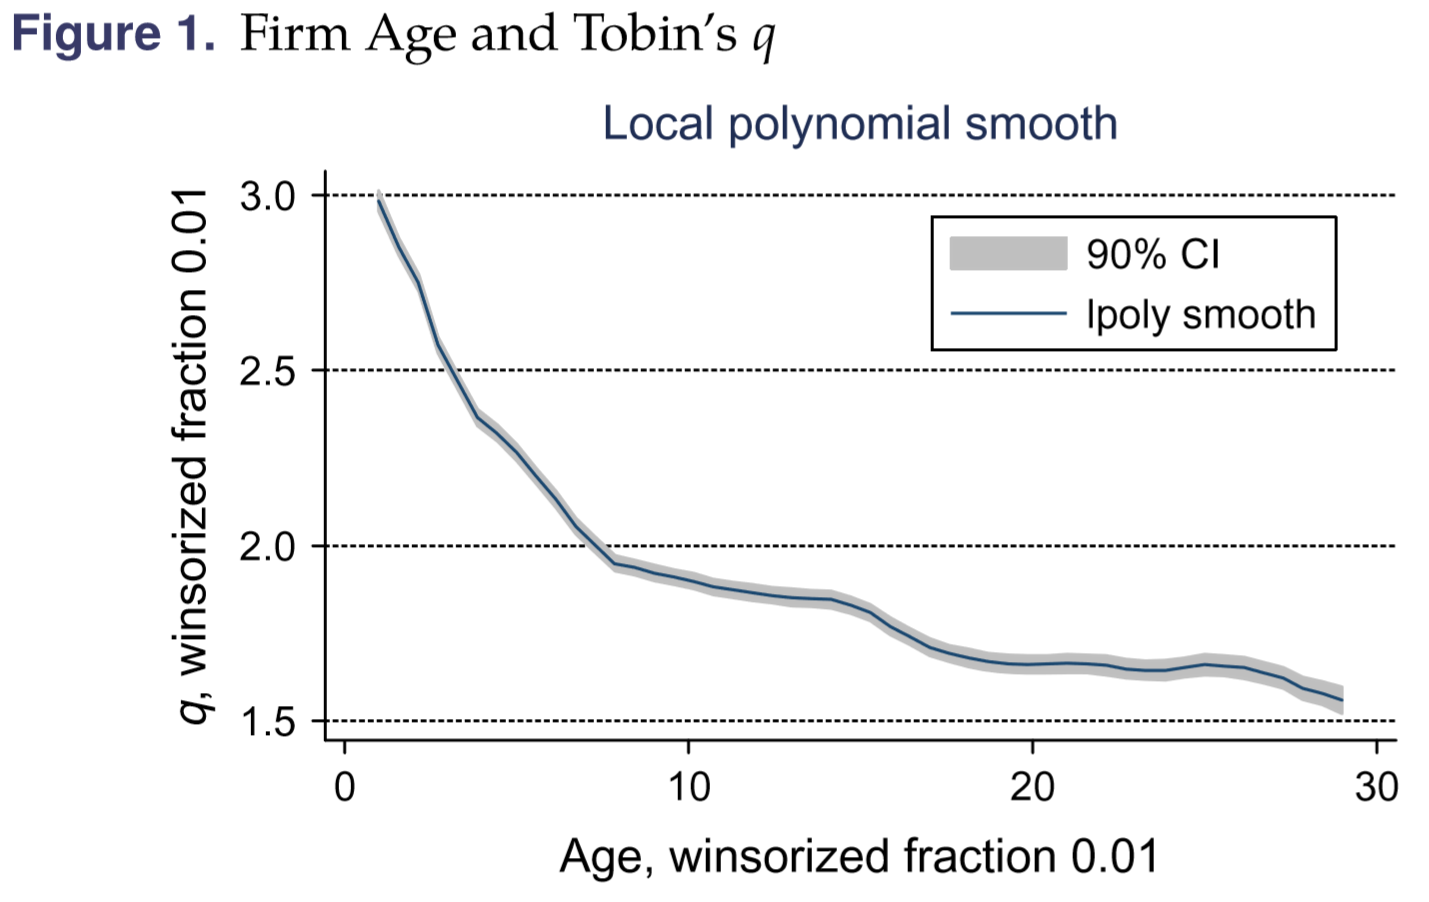
The evidence is that the typical firm gradually runs out of attractive growth opportunities as it grows older. If the typical mature firm lacks attractive projects, it should abstain from significant new investments and, instead, return capital to its shareholders. In doing so, it frees resources that are trapped in relatively outdated structures and makes these resources available to the shareholders for reinvestment into new ventures.
Summary
This section has argued that a dollar of cash does not seem to be much more valuable inside a firm than outside a firm. It often seems to be the case that mature firms generate more cash with their business than they can reinvest into valuable new growth opportunities. As these valuable growth opportunities dwindle, mature firms should increasingly return capital to their shareholders.
It is important to note that these considerations apply to the average (mature) firm. Clearly, there are cases where mature firms come across great investment opportunities. In these cases, they should invest rather than returning money to shareholders. And there are certainly also cases where firms are too obsessed with payouts and therefore forego valuable projects. But the evidence implies that these cases are the exception and not the rule.
Finally, it is important to note that these considerations are generally consistent with how the market assesses mature firms. As we discuss in great detail in the module Continuing Value (Valuation of Mature Firms), a simple valuation model that assumes that firms have no value-enhancing investment opportunities and therefore abstain from new investments does a surprisingly good job at valuing mature firms (see here for a discussion of that model).