Reading: Introduction
2. The Market for Public Offerings
To get a first impression of the market for going public transactions, the following graph summarizes the initial public offering (IPO) activity in the United States over the years 1980 to 2017. The data for the graph are from Professor Jay Ritter's Website at the University of Florida, arguably the richest source of research quality IPO data.
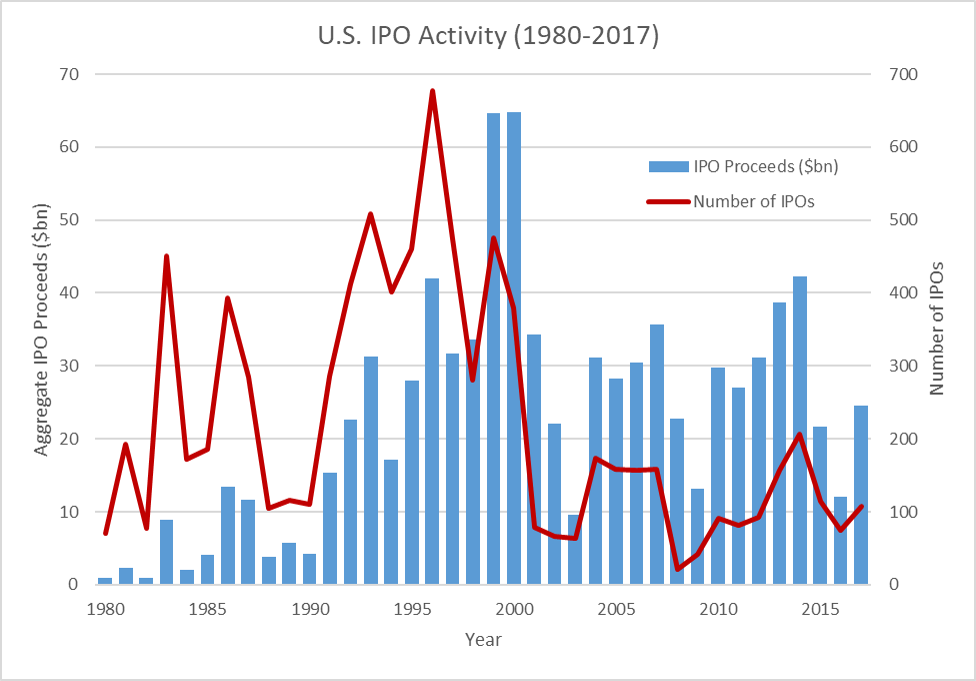
Number of U.S. IPOs
The red line shows the number of firms that engaged in an initial public offering (IPO) in any given year (right axis). It shows that IPOs are fairly cyclical. They experienced their heydays during the dot-com wave in the 1990ies, where approximately 500 new companies listed their shares per year, which corresponds to approximately 2 IPOs per trading day. In more recent years, the IPO activity has slowed dramatically, with an all-time low of 21 transactions in 2008, the year of the "financial crises." Since then, the market has somewhat recovered, so that in a typical year, approximately 100 U.S. firms list their securities each year, which corresponds to roughly 2 IPOs per trading week.
IPO Proceeds
The blue bars indicate the total amount of capital that was raised with IPOs in the U.S. in any given year, expressed in billions of USD (left axis). While these so-called IPO proceeds are also cyclical, they do not mirror the decline in the number of transactions that we have discussed before.
The reason is that, in more recent years, the average IPO firm has raised considerably more money than in earlier years. For example, the data imply that in the 1990ies the average IPO has generated gross proceeds of approximately $71 million. In contrast, between 2010 and 2017, the average gross proceeds were almost $240 million.
International Evidence
With the globalization of financial markets, also the IPO activity becomes increasingly global. The following graphs, which are from a quarterly report on the Global IPO trends prepared by EY, provide a rough summary of that market:
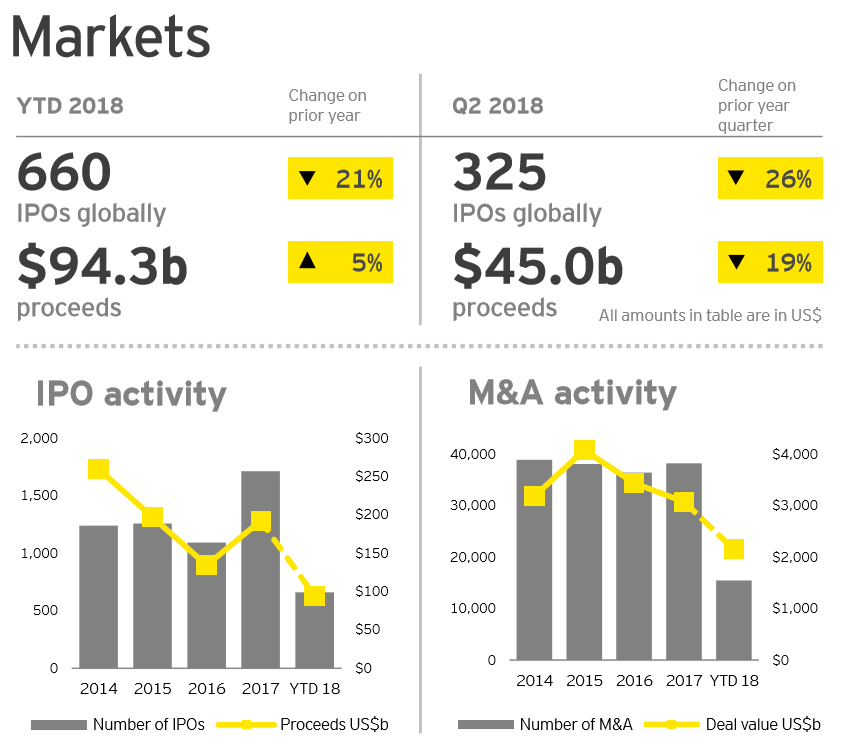
The main takeaways are as follows:
- The annual number of IPOs is typically somewhere between 1'200 and 1'800, and the annual gross proceeds are around $200 billion (left side of first graph).
- In comparison, there are roughly 40'000 M&A transactions per year globally, with a total deal volume of roughly $3.5 trillion. The market for IPOs is therefore much smaller than the global M&A market (right side of first graph).
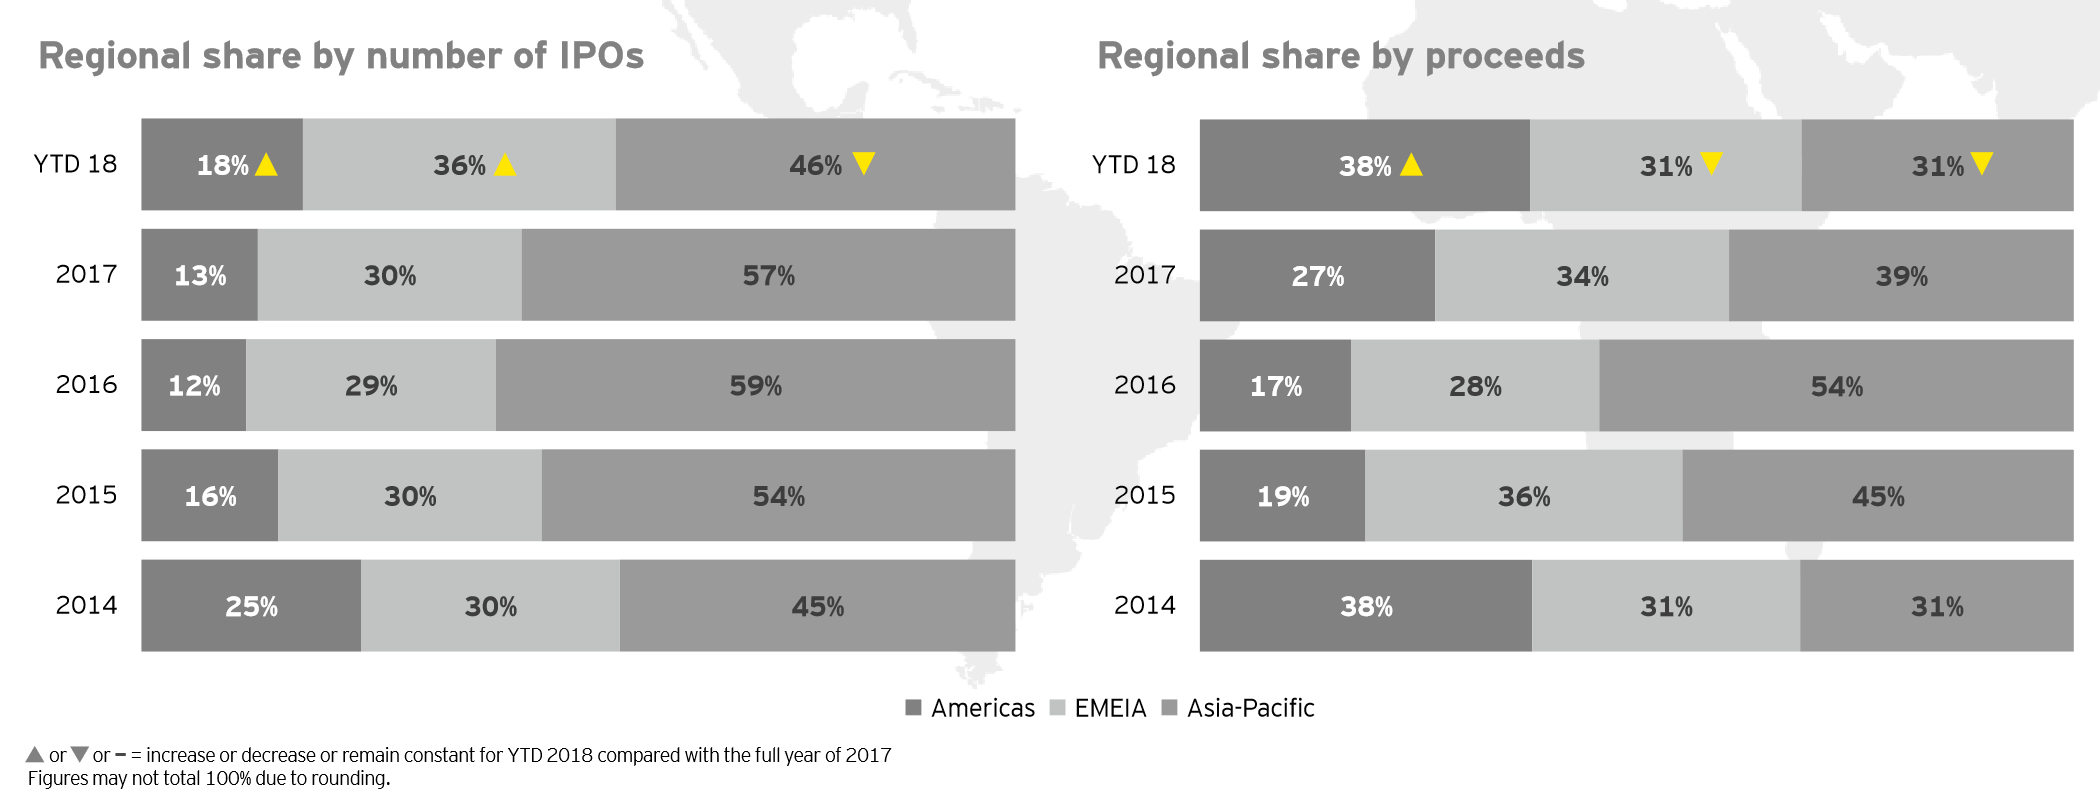
- The market share of the Americas (mostly the U.S.) has been decreasing consistently over the last few years, whereas Asia-Pacific has picked up momentum:
- By now, less than 1 out of 5 firms that IPO is from the Americas
- In contrast, Asia-Pacific represents almost 3 out of 5 global IPO firms.
- The market share of EMEIA (Europe, Middle-East, India, and Africa) is relatively stable at 30%.
- Because large firms (still) tend to list in the U.S., the Americas' market share by proceeds is a bit larger than on a deal-count basis.