Reading: WACC for Listed Firms
So far, we have seen what the WACC is and how we use it in firm valuation. This section takes a brief look at how to estimate the WACC in practice.
5. Appendix: What's Beta?
We have seen in the preceding sections that "Beta" is an important element in the estimation of the cost of capital. We have argued that beta measures the risk of the asset in question and thereby allows us to compute the appropriate risk premium investors will ask for when investing in this asset.
But what does risk actually mean? The purpose of this section is to provide a brief non-technical answer to this important question.
We are all aware of the fact that stock returns fluctuate. Very generally speaking, the reason for this fluctuation is twofold:
- Asset-specific risk (idiosyncratic risk): Stock prices fluctuate because of new information that is specific to the firm. For example, the stock price of Facebook dropped by roughly 20% on July 26, 2018, in reaction to the news that revenues and earnings will grow less rapidly than expected. This new information primarily affected the value of Facebook's shares and left other asset values the same (for example, the stock price of ExxonMobile did not react to these news).
- Market risk (systematic risk): In addition, stock prices can fluctuate because of new information that is relevant to the overall market. For example, good news about the labor market will tend to increase stock prices across the board whereas fears of inflation or an overheating of the capital market will impose downside pressure on stock prices across the board.
Why is this relevant? Because these two types of risk have fundamentally different implications for investors:
- Market risk cannot be avoided:
- Because market risk affects all risky assets, investors cannot avoid it.
- As soon as they invest in risky assets, they are exposed to market risk and, consequently, demand a compensation for that market risk.
- The only way to steer the exposure to market risk is to change the portfolio allocation between risk-free assets (typically government bonds) and risky assets (stocks, corporate bonds, commodities, real estate, etc.).
- Asset-specific risk can be diversified:
- In contrast, the risk that arises from firm specific events can be diversified!
- As soon as investors spread their wealth across MANY different assets, the relevance of firm-specific events disappears.
- In the context of the above example, the bad news that Facebook had to convey in July 2018 will only affect a very small portion of a well-diversified shareholder's portfolio, since Facebook accounts for only a tiny fraction of the global equity market. Moreover, chances are that other companies conveyed good news at the same day, so that the various firm-specific effects cancel each other out.
- Because investors can diversify asset-specific risks with the appropriate portfolio construction, this type of risk is NOT rewarded with a higher expected rate of return!
And what does all of this have to do with "Beta?"
The above considerations imply that only the "systematic" component of an asset's risk will be compensated with a higher expected return whereas the asset-specific risk receives no extra compensation (because, as we just said, investors can diversify it). Therefore, when we look for a risk measure, what we actually look for is a measure of an asset's systematic risk. The asset's beta is one such measure. It indicates how much systematic risk an asset has relative to the overall risk of the market. For any asset j, the beta (βj) is:
\( \text{Beta}_j = \beta_j = \frac{\text{Systematic risk}_j}{\text{Market risk}} \)
A typical risk measure is the volatility of the asset's return, as measured by the standard deviation of the stock return (σj). The following figure provides a graphical illustration of how to extract the systematic risk of a stock from it's total risk:
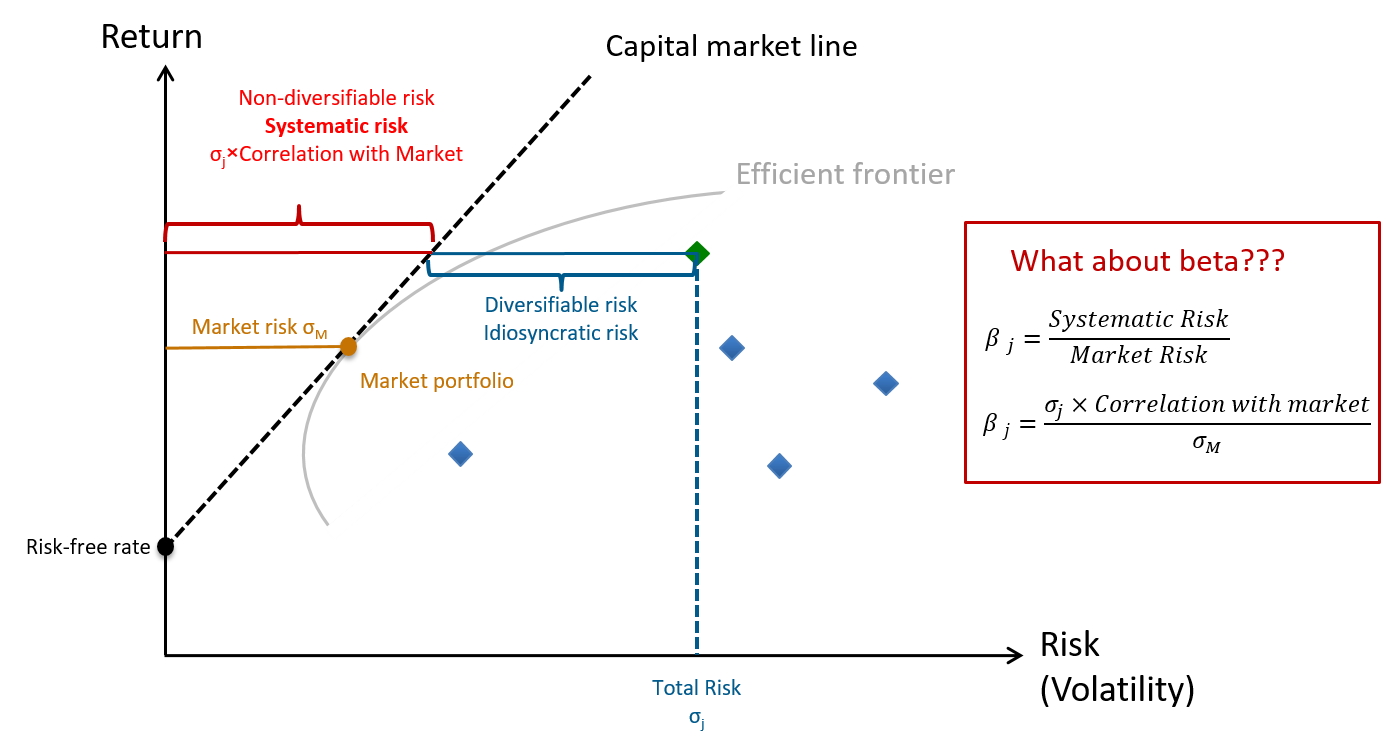
Here some explanations for how to read the figure:
- The figure shows the risk (horizontal axis) and return (vertical) axis for investors.
- At the bottom left is the risk-free rate of return. This is the amount of return an investor can earn without incurring any risk.
- The dashed line then depicts the so-called capital market line. The capital market line reflects the classical risk-return trade-off for a perfectly diversified investor. It shows how much risk such a perfectly diversified investor must accept to earn a specific rate of return. The higher the investor's target return, the higher the amount of risk that she has to accept.
- How to identify that capital market line?
- Investors want to earn as much return as possible for any given level of risk. Put differently, what they want is to make the dashed line as steep as possible.
- As we have argued above, however, there are limits to diversification because there are certain risky elements that all assets share (the so-called market risk).
- The grey line in the graph shows these limits to diversification. For any given level of risk, it shows the maximum possible return a portfolio that solely consists of risky assets can generate. This is why the gray line is generally referred to as the efficient frontier: It depicts the portfolios of risky assets with the best possible return for any given level of risk.
- The investor's task is now to find the portfolio of risky assets on the efficient frontier that, in combination with the risk-free assets, allows for the best risk-return trade-off (the steepest dashed line)
- That point is the so-called market portfolio: The dashed line is the steepest if we run it through the market portfolio. All other portfolio choices would result in a flatter line and therefore a less beneficial risk-return trade-off.
- Consequently, the risk-return trade-off is determined between how much of her capital the investor allocates to the risk-free asset and how much she invests in the market portfolio.
- If she invests everything risk free, the portfolio return will correspond to the risk-free rate.
- The more she shifts from the risk-free asset into the market portfolio, the further up she will move along the capital market line.
Now that we have a basic understanding of the graph, we can take a look at what it has to do with the "beta" of an asset:
- To do so, let us consider one specific asset, whose risk and return are depicted by the green point in the graph.
- This asset has a specific total risk, as denoted on the horizontal axis with σj.
- Following from our initial discussion, we know that a part of that risk can be diversified whereas a part of risk is non-diversifiable (systematic).
- Put differently, it is possible through diversification to generate a portfolio that has the same expected return as the asset in question but a much smaller risk. This diversifiable risk, denoted with the blue line, will not be compensated.
- Only the remaining systematic risk, denoted with the red line, will be compensated: In order to earn an expected return equal to that of the asset j, a perfectly diversified investor will have to incur that systematic risk.
- Beta now measures how large that remaining systematic risk is relative to the market risk (golden line). Put differently, it measures how long the red line is relative to the golden line.
- As it turns out, one can show that the systematic risk of an asset corresponds to the total risk of the asset times the correlation between the asset and the market:
Systematic riskj = Total riskj × Correlation between j and Market
Example
Let's assume the asset in question has a volatility of 50% whereas the market portfolio has a volatility of 20%. We also know that the correlation between the return of the market portfolio and the asset's return is 0.60. What beta does the asset in question have based on these numbers?
- The correlation of 0.6 implies that 60% of the assets risk cannot be diversified. Consequently, the asset's systematic risk is 30%:
Systematic riskj = Total riskj × Correlation between j and Market = 0.5 × 0.6 = 30%.
- Relative to the market portfolio, which has a risk of 20%, the assets systematic risk is 1.5 times higher. This is the assets beta:
\( \text{Beta}_j = \beta_j = \frac{\text{Systematic risk}_j}{\text{Market risk}} = \frac{0.3}{0.2} = 1.5 \)
To compute the assets required rate of return with the CAPM, we would therefore add 1.5 times the market risk premium to the risk-free rate of return.