Reading: Return and Standard Deviation
2. Returns of Stocks and Bonds
Of course, the stock of P&G is just one of the many assets that investors can choose from. More generally speaking, investors can invest in stocks, bonds, and other assets such as real estate, art, luxury cars, etc.
The following graph shows the cumulative returns of U.S. equities, bonds, and bills over the period 1900 - 2017. The graph is extracted from Credit Suisse's Global Investment Yearbook 2018.

The main takeaways from this graph are:
- During the 117 years under investigation, a dollar invested in U.S. equities in 1900 grew to $47'661 by the end of 2017. Expressed on an annual basis, this corresponds to an average annual return of 9.6% (geometric mean).
To find this return, remember the computation of future values: \( FV = C_0 \times (1+R)^T \). We can solve this expression for the annual rate of return R:
\( R = \left( \frac{FV}{C_0}\right) ^{\frac{1}{T}}-1 \)
In the case of U.S. equities, we have C0 = 1, FV = 47'661, and T = 117. Consequently:
\( R = \left( \frac{FV}{C_0}\right)^{\frac{1}{T}}-1 \) \(= \left( \frac{47'661}{1}\right)^{\frac{1}{117}} \) \(-1=0.0964=9.64\% \)
- In contrast, the identical investment of $1 in U.S. treasury bonds would "only" have grown to $239 during the same period, for an average return of 4.9% per year.
- Finally, U.S. treasury bills have delivered an average rate of return of 3.7%, still beating the rate of inflation of 2.9%.
Note that treasury bills and treasury bonds are marketable fixed-income securities issued by the U.S. Department of Treasury. They are among the safest securities in the world, since the U.S. government guarantees them. The difference between bills and bonds is in the maturity of these securities. Treasury bills have a maturity of less than 1 year whereas treasury bonds have maturities between 10 and 30 years. In between are the treasury notes with maturities between 1 and 10 years.
Risk and Return...
The previous figure has shown that, in the past, equities have earned a much higher return than bonds or bills. So why would anyone want to invest in bonds and bills, given their much lower returns? The obvious answer is risk. Most likely, equities yielded higher returns than bonds or bills because they have a higher risk. While their return exceeds the return on bonds and bills, on average, not every year sees equities on top. There are years such as 2008, when equities performed horribly as a result of the financial crisis, whereas bonds and bills did fairly well.
The following graph from Credit Suisse's Global Investment Yearbook 2018 plots a histogram of the difference between equity and treasury bills returns, the so-called equity risk premium, for every year between 1900 and 2017.
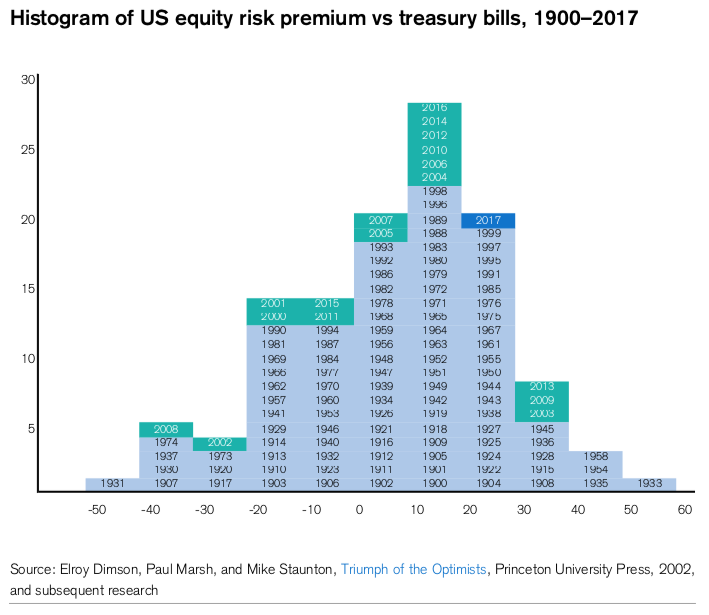
- To the very left of the graph we see that worst year was 1931, when equities underperformed bills by 45%.
- In the other extreme, the very right of the graph shows that the best year for equities was 1933, when their return exceeded the return on bills by 57%.
- Most importantly, the histogram shows that the distribution of the historical equity risk premium is very wide. It is roughly symmetrical around an arithmetic mean of 7.5% per year and it vaguely resembles the bell-shaped pattern of a normal distribution.
- On average, and in the long run, U.S. investors received a large positive reward for their exposure to the additional risks of equities.
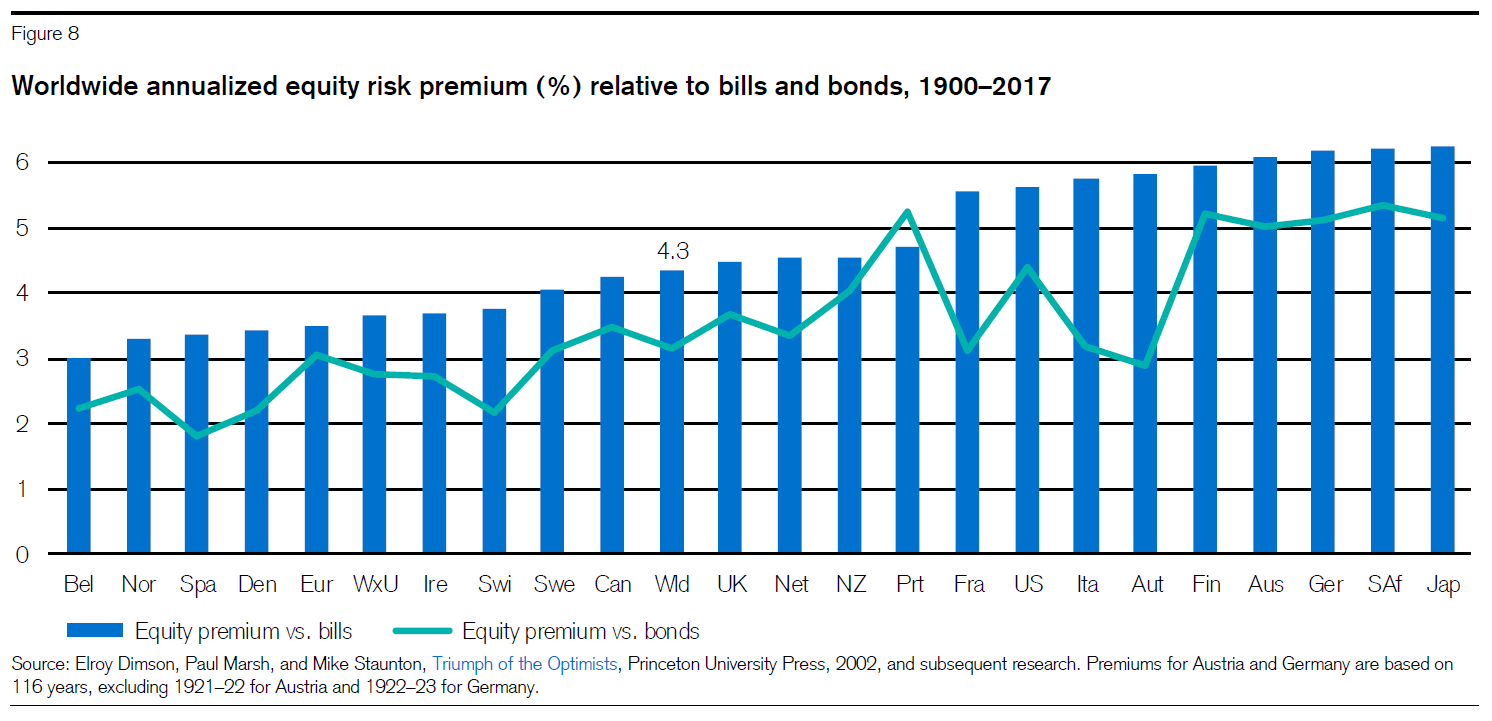
The regularity that equities earn higher returns than bonds/bills, on average, is not limited to the U.S. As the Credit Suisse Global Investment Yearbook 2018 continues to show, other markets offer similar equity risk premia. Most notably, over the period 1900-2017, the global equity risk premium over bills was 4.3%, on average, and it was 3.2% compared to bonds, on average (geometric means):
These numbers suggest that there is a clear positive relation between risk and return. In what follows, we take a closer look at this relation. In particular, we want to understand what "risk" actually means and how to get from "risk" to "risk premium."