Reading: Return and Standard Deviation
3. Return Distribution
Annual Returns of Stocks and Bonds
To get a first idea of the risk of equities, the following graph plots the annual returns of U.S. equities (approximated by the S&P 500 index with reinvested dividends) and 10-year U.S. Treasury bonds. Due to data availability, the observation period is slightly different from the previous page, namely 1928-2018. The data are from Damodaran (2018).
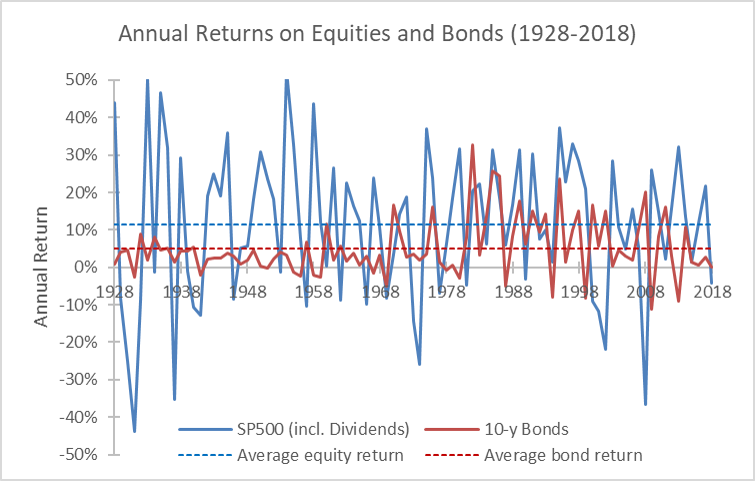
As one can see, equity returns (blue line) exhibit a much stronger oscillation around their average value (dashed blue line, 11.4% per year) than bond returns (red lines, average value of 5.1% per year). That's the essence of risk: Returns correspond to their average (expected) value only by coincidence. In any given year, they can be much larger or much smaller than the average.
In the case of equities, the graph implies that annual equity returns are in fact somewhere between -40% and +50% each year. Put differently, if we were to forecast the return of the S&P 500 index over the next year, the graph suggests that "somewhere between -40% and +50%" would be a safe (though utterly useless) statement. In contrast, if our task were to predict next year's bond returns, the resulting interval could be much smaller—for example "somewhere between -10% and +20%"—as bond returns oscillate less.
Clearly, such a qualitative assessment of risk is not very helpful. To start a meaningful discussion about "risk," we therefore need to find a way to quantify the riskiness of an asset.
Return Percentiles
The following table summarizes the return distribution of stocks and bonds from the graph before. In addition to the average, minimum, and maximum returns that we have already discussed, it also provides additional information about the likeliness that the return of an individual year falls below a certain threshold—the so-called percentiles. For example, the 10% percentile of -10.67% indicates that equities lose more than 10.67% in one out of 10 years. Similarly, the 25% percentile shows that 1 out of 4 years sees a stock return below -1.2%. The corresponding percentiles for bonds are much closer to the average bond return, which supports our conclusion from before that bond returns oscillate less:
| S&P 500 | 10-y Bond | |
| Average (arithmetic mean) | 11.36% | 5.10% |
| Minimum | -43.84% | -11.12% |
| Maximum | 52.56% | 32.81% |
| 10% percentile | -10.67% | -2.26% |
| 25% percentile | -1.20% | 0.88% |
| 50% percentile | 13.52% | 3.27% |
| 75% percentile | 24.45% | 8.34% |
| 90% percentile | 32.60% | 15.98% |
| Standard deviation (Volatility) | 19.58% | 7.70% |
| Correlation | −0.022 | |
Standard Deviation (Volatility)
Close to the bottom, the table also shows the "standard deviation" of the stock and bond returns. This measure of dispersion quantifies by how much the annual returns differ from their mean value.
The standard deviation is an extremely popular risk measure in portfolio theory (and risk management). If we assume that asset returns follow a normal distribution (also known as Gaussian distribution or a Bell curve), all we need to know is the average return as well as the standard deviation of the returns to completely characterize the return distribution of an asset.
This assumption of a normal distribution therefore dramatically simplifies the analysis. Instead of describing individual returns at lengths, we can characterize the historical return distribution of U.S. stocks with the simple statement that the annual average equity return was 11.36% with standard deviation 19.58%.
The following graph checks whether the assumption of a normal distribution is suitable for U.S. equity returns. The blue bars show a histogram of the actual annual returns of U.S. stocks over the period 1928-2018. The red line shows the theoretical approximation of this return distribution if we assume that U.S. stock returns are normally distributed with an average return of 11.36% and a standard deviation of 19.58%:
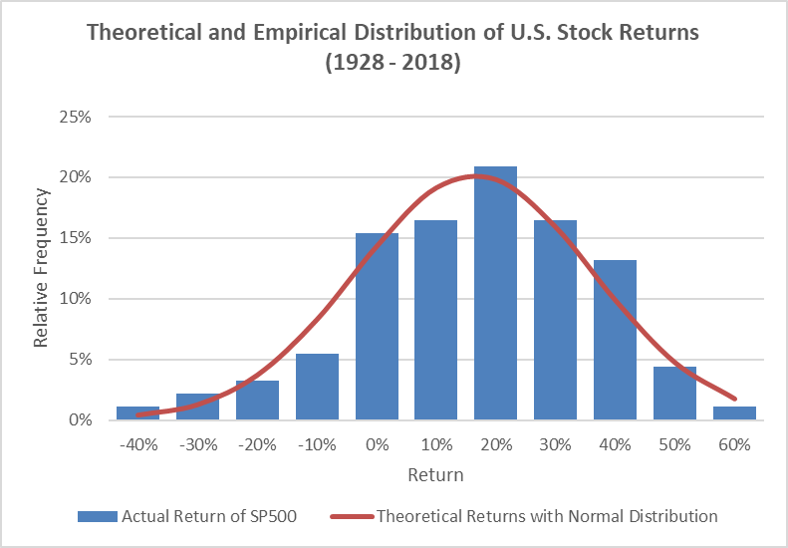
The graph shows that the normal distribution does a fairly decent job at describing the actual distribution of returns. For the purpose of this module, we will therefore follow the convention in portfolio theory and make the working assumption that returns are roughly normally distributed.