Reading: Return and Standard Deviation
5. Practice Example
With the knowledge from the preceding sections, we should now be able to compute the average and standard deviation of any return series. As a practice example, let us compute these values for the full time series of stock and bond returns over the years 1928-2018. Given the long time series, it is slightly easier to run the computations in Excel... Therefore, the attached Excel file contains the raw data of the return series:
- Column B lists the years
- Column C shows the annual stock returns (S&P500, including dividends)
- Column D shows the annual bond returns (10-year Treasury Bond)
Row 4 shows the values for the first year (1928) and row 94 shows the values for the last year (2018):
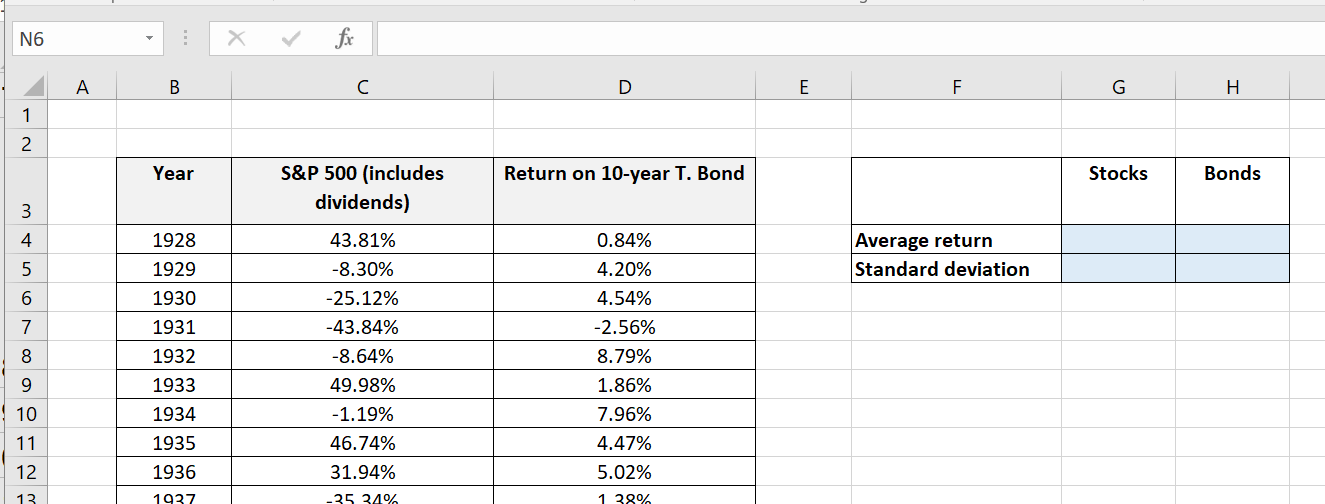
Let us now compute the average return and the standard deviation of the return of stocks and bonds in the blue fields to the right of the table. The following summarizes the functions that we have to enter in the respective fields. Note that the attached Excel file has a second worksheet "Solution," which contains the solutions of these calculations.
| Cell | Description | Formula | Result |
| G4 | Average stock return | =AVERAGE(C4:C94) | 11.36% |
| G5 | Standard deviation of stock return | =STDEV(C4:C94) | 19.58% |
| E4 | Average bond return | =AVERAGE(D4:D94) | 5.10% |
| E5 | Standard deviation of bond return | =STDEV(D4:D94) | 7.70% |
With this knowledge, we are now ready to take the next step and think about the combination of various assets into portfolios.
Before doing so, however, it is important to go back to some of the assumptions we made and issue a few words of caution.