Reading: Introduction to Diversification
2. Risk-Return Trade-off
Remember from before that we have computed the following long-term average returns and standard deviations for U.S. stocks and bonds:
| U.S. Stocks | U.S. bonds | |
| Average annual return (1928 - 2018) | 11.36% | 5.10% |
| Standard deviation | 19.58% | 7.70% |
We can depict these assets in a diagram where we report the average return on the vertical axis and the standard deviation (risk) on the horizontal axis:
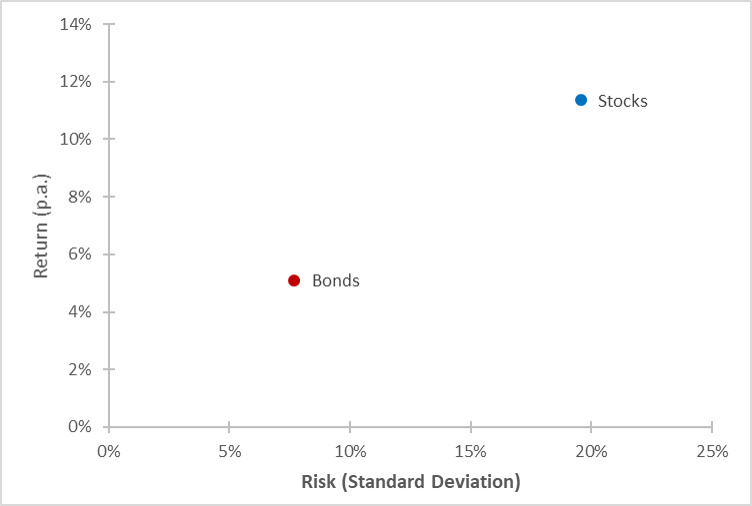
This graph will accompany us for the next few steps, so it is important to remember what it shows: Fundamentally, it the graph illustrates a trade-off between risk and return:
- Investors who invest in stocks can expect to earn a higher return, but they also have to accept a higher risk.
- In contrast, investors who buy bonds will earn a lower but safer return, on average.
The typical investor does not like risk. She is risk averse.
- In the diagram, IF she faced a choice between an asset in the top left (high return and low risk) and the bottom right (low return and high risk), she would clearly go for the asset in the top left, as it offers a higher return and a lower risk.
- However, such a choice is often not available. If, instead, she has to choose from the two assets that are actually available in the graph (stocks and bonds), the answer is not clear. Whether she chooses to invest in stocks or bonds depends on her personal risk preferences.
In reality, the investor does not have to invest all her wealth in stocks OR bonds. To the contrary, she could form a portfolio that allocates some of her wealth to stocks and some of her wealth to bonds (as well as other assets such as real estate, art, gold, etc.).
By forming a portfolio, the investor gains exposure to the risk of both assets (stocks and bonds). As we will see later on, this can be exceptionally beneficial: If she picks her assets wisely, she can make sure that the individual price movements cancel out each other (at least to a certain extent). As a result, she can reduce the risk of the investment without having to sacrifice expected return! That is the basic idea behind risk diversification, the only "free lunch" in investments.
Whether or not risk can be diversified successfully depends on the correlation between the returns on the assets:
- If asset returns have a high positive correlation, they tend to always move in the same direction. Consequently, there is little potential to diversify risk.
- In the other extreme, if asset returns have a high negative correlation, they tend to move in the opposite direction. This allows investors to diversify the risk, as losses on one asset will be compensated with gains on the other asset, and vice versa.
The crucial concept behind diversification, therefore, is the correlation between the asset returns. Formally, we measure the correlation with the so-called correlation coefficient (\(\rho\)), which, by definition, is always between \(-1\) and \(1\).
To illustrate the magic of diversification, let us consider a very simple and, admittedly, unrealistic example.