Reading: The Drivers of ROE
1. Du Pont Identity
Return on Equity (ROE) is arguably the most important financial ratio. Shareholders focus on it because it summarizes the firm's performance from their point of view and indicates how well their capital is invested. Managers also put a lot of emphasize on ROE because their compensation is often tied to specific ROE targets.
It turns out, however, that we have to be careful when interpreting ROE figures. We need to know the drivers of ROE to understand how changes in ROE come about and why different firms in similar industries might have very different ROE figures.
Remember from before that ROE is defined as:
ROE = \( \frac{\text{Net income}}{\text{Average equity}} \)
The following points are worth noting:
- Net income in the numerator is ultimately a measure of the firm's operating performance. With a given amount of sales, a higher net income implies better operating performance. All else the same, the better the firm's operating performance, the higher is it's ROE.
- The (average) book equity in the denominator has two main drivers:
- The amount of capital that is required to run the firm. Ultimately, this is a question of how efficently the assets are managed. All else the same, the higher the firm's efficiency the higher is it's ROE.
- How much of that capital is contributed by the shareholders. Ultimately, this is a question of financing policy. A firm with an aggressive debt policy will require less equity to finance a given set of assets. Therefore, all else the same, the lower the firm's equity ratio the higher is it's ROE.
These brief considerations imply that ROE is the result of three important dimensions:
- Operating performance
- Efficiency
- Financing policy
We have to keep this in mind when interpreting levels and changes in ROE. For example, an increase in ROE does not necessarily mean that the firm is performing better. It could simply mean that the firm has chosen a more aggressive debt level. While this increases the ROE, it also increases the risk for the shareholders. A detailed discussion of these considerations goes beyond the scope of this course. It will be the topic of the course "Leverage and the Cost of Capital."
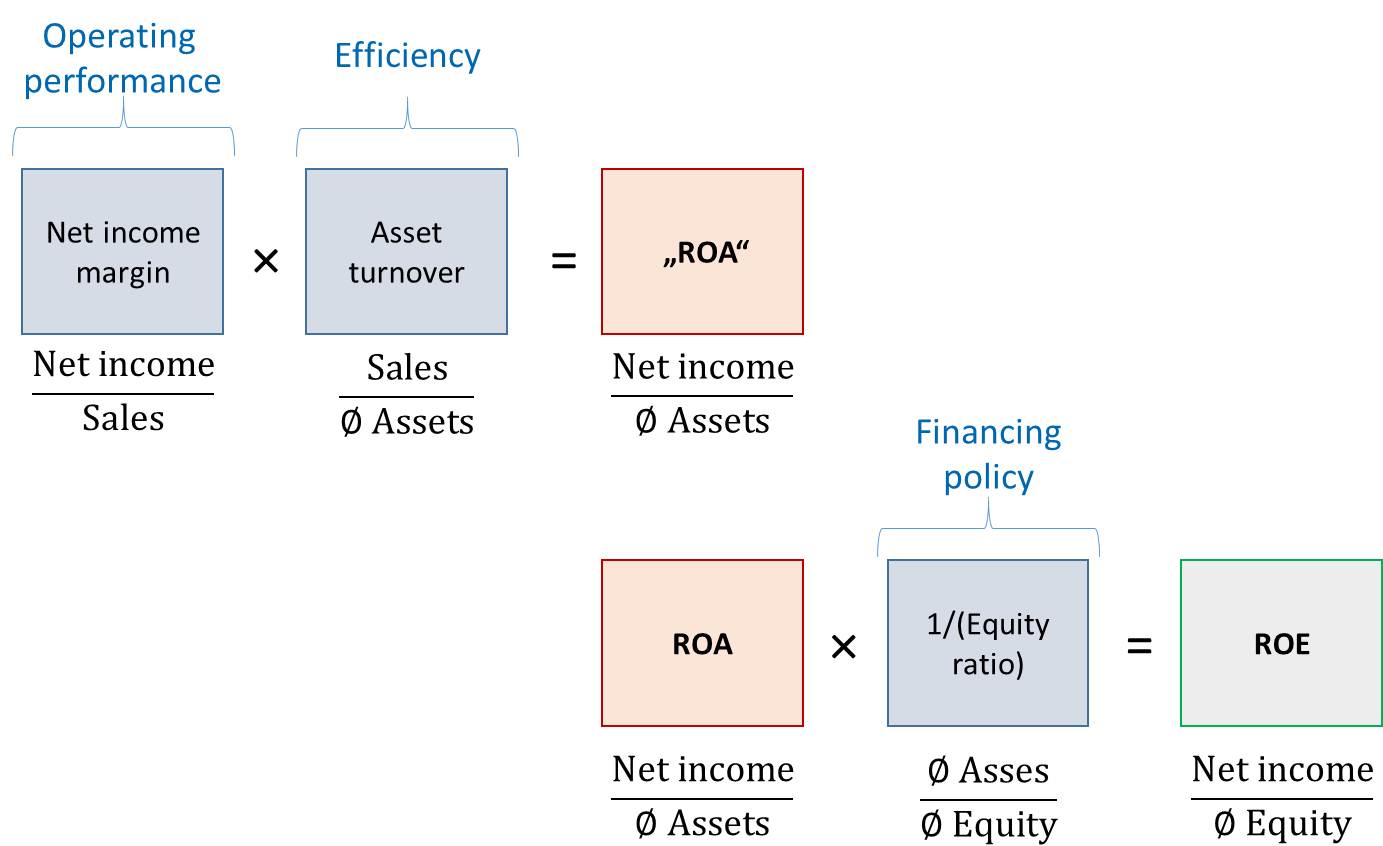
The following figure shows the decomposition of ROE into the three components discussed above. This is the so-called Du Pont Identity. The symbol "Ø" indicates average values.

The first part of the figure shows that Return on Asset (ROA) is the product of operating performance (as measured by the firm's Net income margin) an asset efficiency (as measured by the firm's Sales-to-Assets Ratio).
The second part of the figure shows that Return on Asset (ROE) equals the firm's ROA divided by its equity ratio. Hence, as we have argued above, ROE is the result of the three dimensions operating performance, efficiency, and financing policy.
For an illustration, let's look again at Hershey in 2015. During the previous chapters, we have collected the following information:
- Net profit margin: 6.9%
- Asset turnover (Sales-to-assets): 1.35
We have also talked about financing ratios, though we have not explicitly derived the average equity ratio in 2015. We find it as follows:
Average equity ratio =\( \frac{\text{Average equity}}{\text{Average total assets}} \)
When studying the balance sheet, we see that the average equity was 1'283.5 million and the average assets were 5'483.6 million. Hence, Hershey's average equity ratio was 23.4% [= 1'283.5/5'483.6].
With this information, we can now compute Hershey's ROE in 2015:
ROE =\( \text{Net profit margin} \times \text{Asset turnover} \times \frac{1}{\text{Equity ratio}} \).
ROE =\( 0.069 \times 1.35 \times \frac{1}{0.234} \) = 40%.
This corresponds to the ROE value that we have computed in the previous section. As a comparison, let's look at the ROE that General Mills reports in 2015. Looking at their 10-K report, we can find the following information for General Mills (Their fiscal year ends May 31):
- Net profit margin: 6.9%
- Asset turnover (Sales-to-Asset): 0.78
- Average equity ratio: 0.275.
These numbers imply a ROE for General Mills' 2015 fiscal year of approximately 20%:
ROE =\( 0.069 \times 0.78 \times \frac{1}{0.275} \) = 20%.
Put differently, General Mill's ROE is only about half of Hershey's ROE. The Du Pont Identity discussed above allows us to identify the sources of this difference in profitability:
- Both firms start out with the same operating performance (net profit margin)
- Hershey had a substantially higher asset turnover than General Mills (1.35 vs. 0.78)
- Hershey also had a somewhat lower equity ratio (0.234 vs. 0.275)
Therefore, the main reason for the performance difference in that particular year would seem the different levels of asset turnover in the two firms.