Reading: Sales and Sales Growth
1. Sales and sales growth
In most industries Sales (Net revenues) are the most important value driver and many of the things that happen in a firm depend more or less directly on sales. It is therefore natural to start the investigatio with a closer look at sales.
The minimum we should know is the firm's sales volume (top line of the income statement) as well as the growth rate of sales. This information is generally readily available.
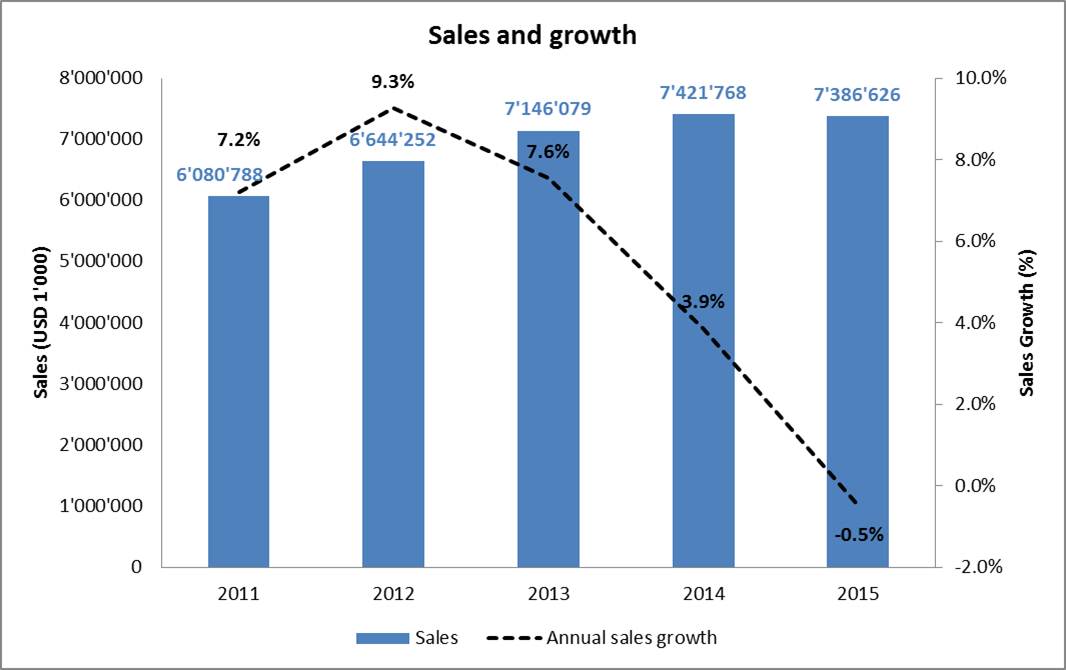
In the case of Hershey in 2015, Net sales were approximately 7'387 million. This correponds to a decrease of 0.5% compared to the previous year. We can also extract from the income statement that, over the previous 5 years, sales grew by an annual rate of 5.5%, on average.
The following figure summarizes the firm's sales and the associated growth rates over the period 2011 to 2015. It is apparent that sales growth has slowed down considerably over the last few years.

A more detailed analysis of sales will then take many additional aspects into consideration. These aspects include:
- Seasonality: Are the sales seasonal (e.g., a ski resort) or are they more or less constant during the year?
- Customer basis: Who are the customers? Does the firm have bulk risks on the customer side (i.e., one very large customer)? What fraction of sales stems from new customer? What fraction from returning customers? etc.
- Product: What's the product life cycle? For how much longer will the firm be able to sell these products? What proportion of sales is from new products? What proportion of sales from existing? Etc.
- Competition: What is the competition doing? How do these numbers compare to those of the competitors, etc.
A detailed discussion of these important items goes beyond the scope of this course.