Reading: Summary
1. Summary
The purpose of the previous sections was to get familiar with the most important tools and instruments Financial Analysis offers to assess the financial health and performance of a company. In particular, we have computed a broad range of ratios to summarize the following dimensions of "performance:"
- Liquidity: Provides an overview of the firm's ability to cover its short-term liabilities.
- Activity: Shows how efficiently the firm manages its assets (and how quickly it converts these assets into cash).
- Debt financing: Sheds light on the firm's financing policy as well as its ability to service the contractual debt obligations.
- Profitability: Measures the firm's ability to generate profits.
- Payout policy: Summarizes the firm's cash payouts to shareholders.
- Value creation: Tries to assess whether the profits the firm generates are sufficient to cover the cost of capital.
This section reviews the key ratios for each of these dimensions. To do so, we go back to The Hershey Company, the company that has accompanied us through the previous sections. For each dimension of performance, we graphically show the development of the key ratios over the last five years.
The corresponding Excel file is available in the course folder.
LIQUIDITY
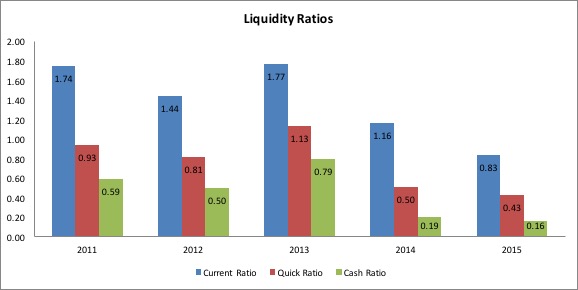
The figure shows that the firm's liquidity has decreased considerably over the last few years:
- Regardless of how we measure liquidity, the ratios dropped by more than half over the last five years
- Between 2011 and 2013, the firm could more or less cover the short-term liabilities with its Cash and Accounts receivable (Quick Ratio). For 2014/2015, this ratio dropped to about 0.5.
- Similarly, the current assets used to exceed the current liabilities (Current ratio) by a factor of about 1.7. In 2015, the current assets dropped below the current liabilities.
- A closer look at the balance sheet reveals that the firm's financing policy might be the main driver of the drop in liquidity. Hershey's short-term financial liabilities have increased considerably since 2013.
ACTIVITY
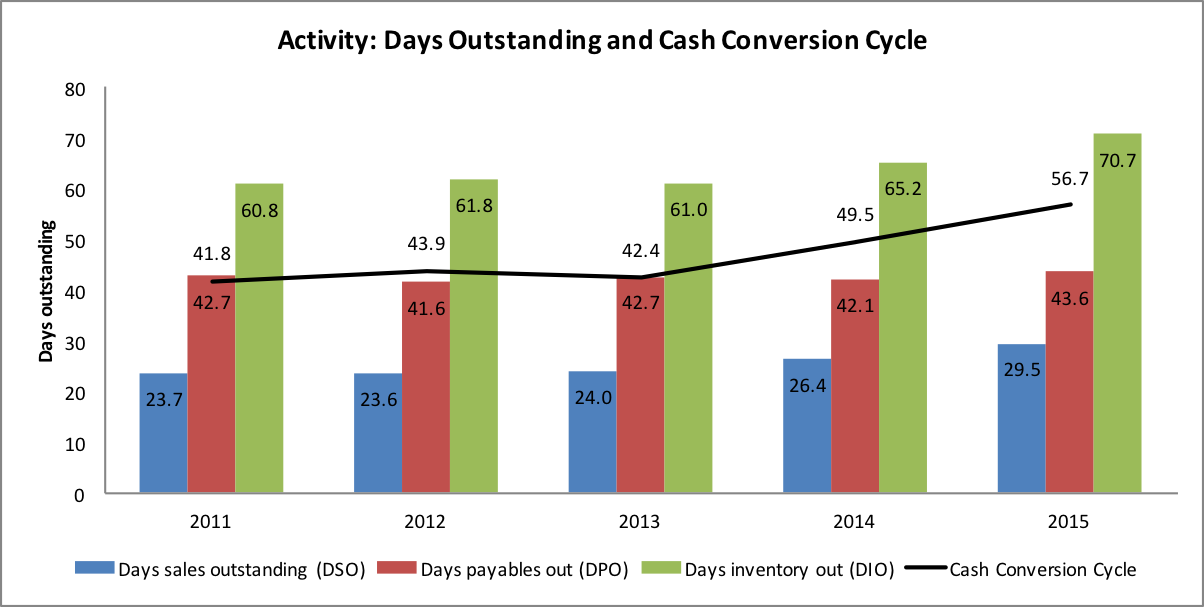
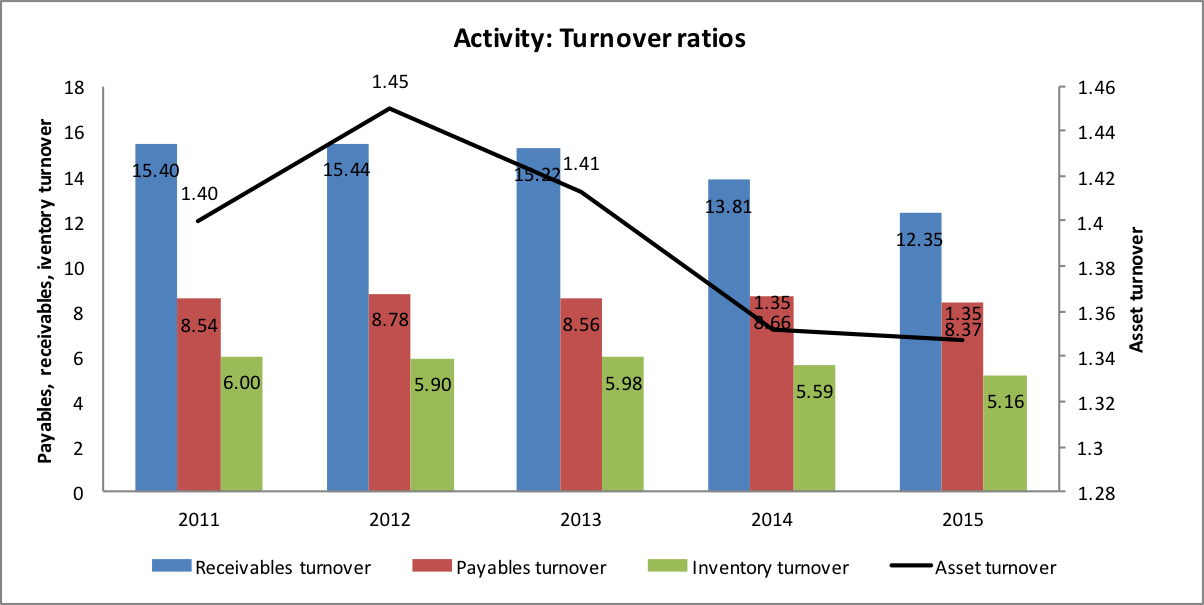
The two charts above show how efficiently the firm manages its accounts payable, accounts receivable, inventory, and assets. The second chart reports turnover ratios (per year). The first graph translates these turnover ratios into days outstanding.
- Accounts receivable: The collection period of accounts receivable has steadily increased over the 5 years under considerations. In 2015, the average customer pays the bill about 6 days later than in 2011. This corresponds to a 25% increase in the days sales outstanding (DSO)
- Inventory: Also the inventory has increased. While the firm turned over its inventory 6 times in 2011, the turnover rate dropped to 5 in 2015. Consequently the average days of inventory outstanding (DIO) has increased from 61 to 71.
- Accounts payable: In contrast, the firm's management of accounts payable remained essentially unchanged. The firm pays its bills within approximately 42 to 45 days (days payables outstanding, DPO).
Taken together, longer DSO, longer DIO, and constant DPO imply that the firm's cash conversion cycle (CCC) became longer. In 2011, a dollar invested in production and sales converted back into cash within approximately 42 days. In 2015, that number increased to 57 days.
Finally, the firm's asset turnover has slowed down a bit.
LEVERAGE
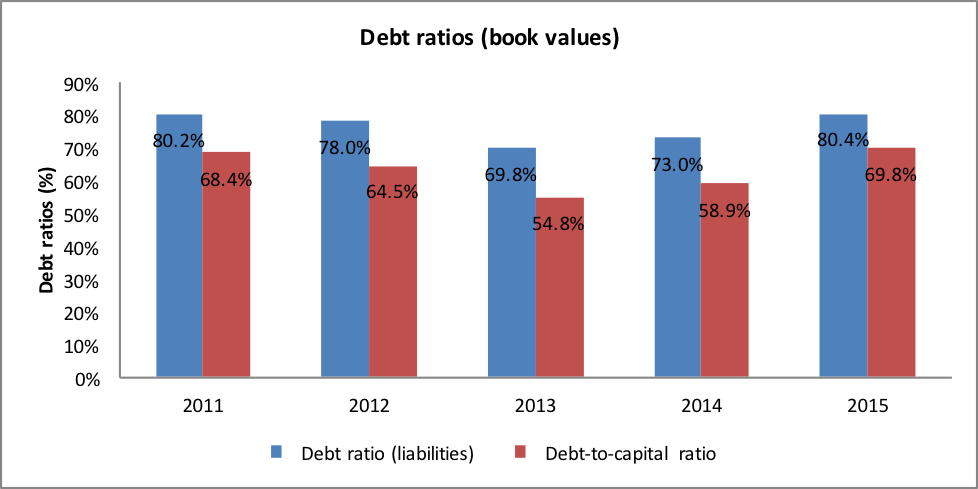
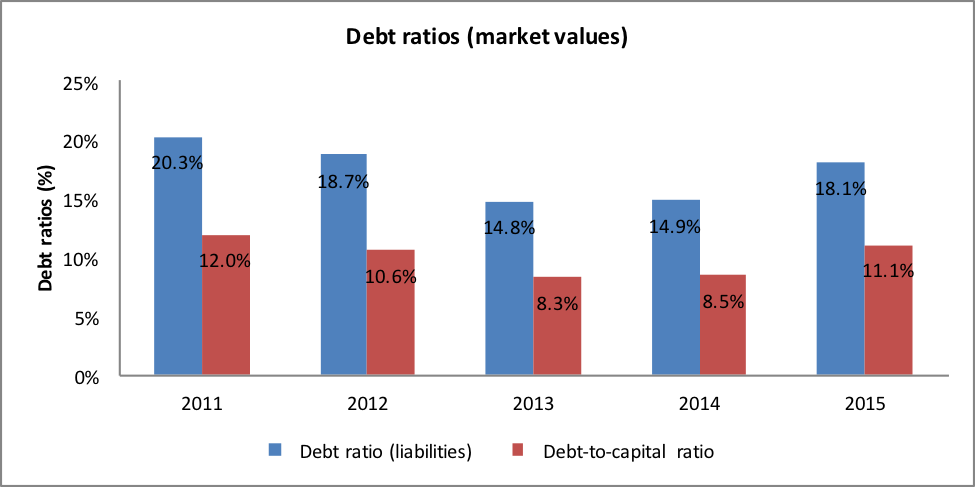
The following two charts summarize the debt ratios in terms of book values and market values, respectively:
- Looking at book values, liabilities account for approximately 80% of the whole balance sheet (debt ratio). When we exclude operating liabilities such as accounts payable, we see that debt accounts for approximately 70% of the firm's capital structure (debt-to-capital ratio).
- The debt ratios were at the same level back in 2011. In between, the have dropped by roughly 10 percentage points in 2013.
- The debt ratios appear fairly high. It would seem to be safe to assume that they will not increase substantially in the future.
- The picture looks different when we look at the ratios in market values. Because the market value of equity exceeds its book value substantially, the debt ratios reported in the second chart are much lower. In terms of market values, liabilities account for roughly 10% of total assets. When excluding operating liabilities, we find that debt makes up roughly 11% of the firm's capital.
- In terms of market values, the financial leverage does therefore not appear to be excessive.
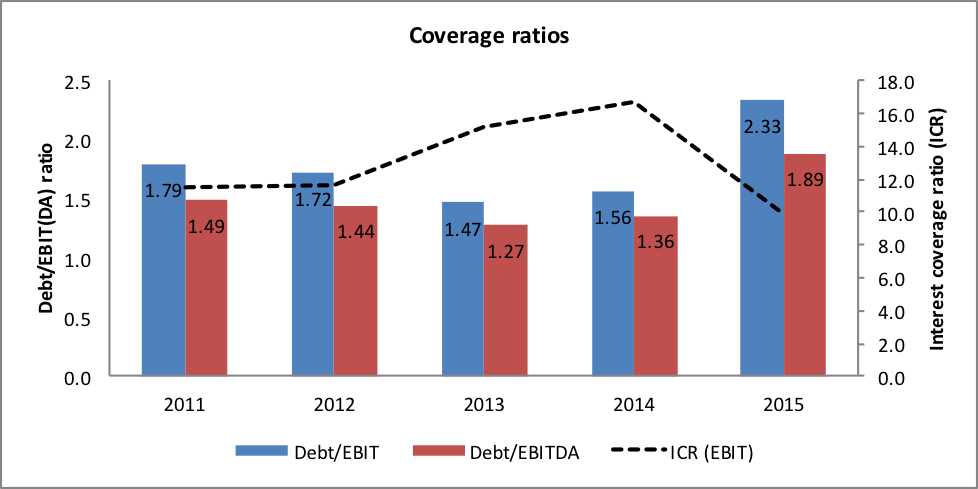
The last chart looks at coverage ratios. It shows to what extent the firm's operating profitability is able to cover the contractual debt obligations.
- While the ratios are fairly stable over the first four years, we see that the credit quality has somewhat deteriorated in the last year. The reason is that the firm's operating performance was less good than in previous years.
- Still, with an interest coverage ratio (ICR) of around 10 and a debt-to-ebit ratio of about 2, the firm's credit quality would seem to be fairly good.
PROFITABILITY
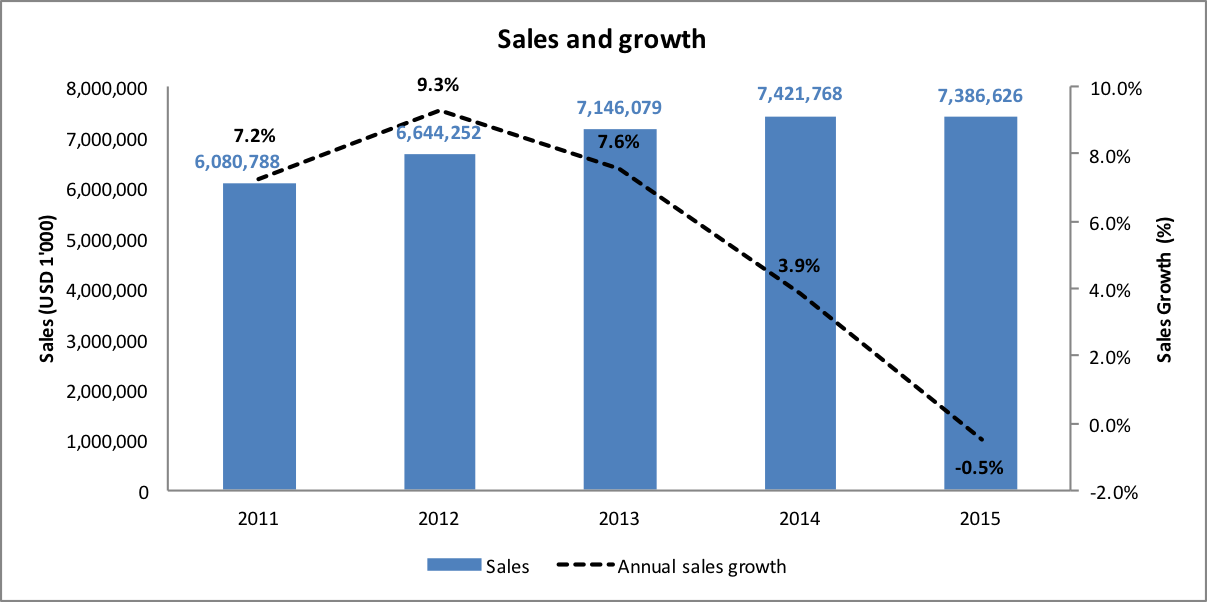
The following three charts summarize the most important profitability measures. Before looking at the actual profitability, it is helpful to take a look at sales, the main driving force of many of the firm's activities.
- We have focused on the level as well as the growth rate of sales.
- The most important takeaway from the first graph is that sales growth has slowed down considerably during the last 4 years, from a peak growth rate of 9.3% in 2012 to a slight decrease by 0.5% in 2015.
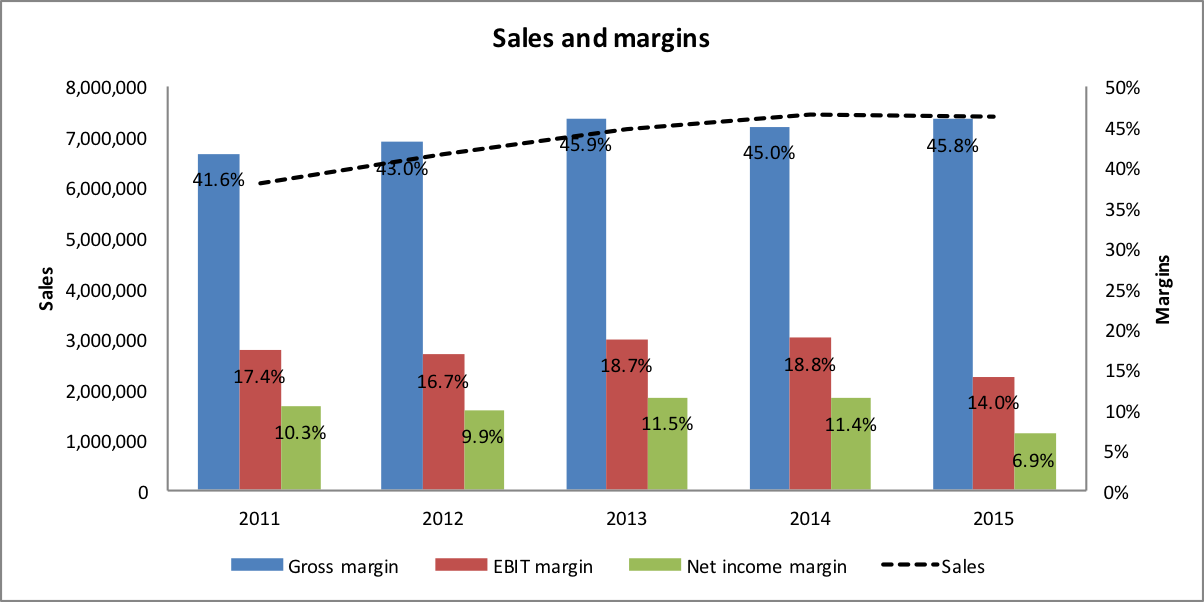
- During the whole period, the firm's gross margin remained essentially unchanged at around 45%.
- The EBIT margin, in contrast dropped quite significantly in the last year. A closer look at the income statement reveals that the main change we observe in 2015 are impairment charges of 280 million. This is important to notice because such impairment charges should not be recurring. Therefore, it could well be that 2015's operating profitability understates the firm's actual earnings power.
- The pattern of the net income margin is comparable to that of the EBIT margin. It took a severe hit in 2015.
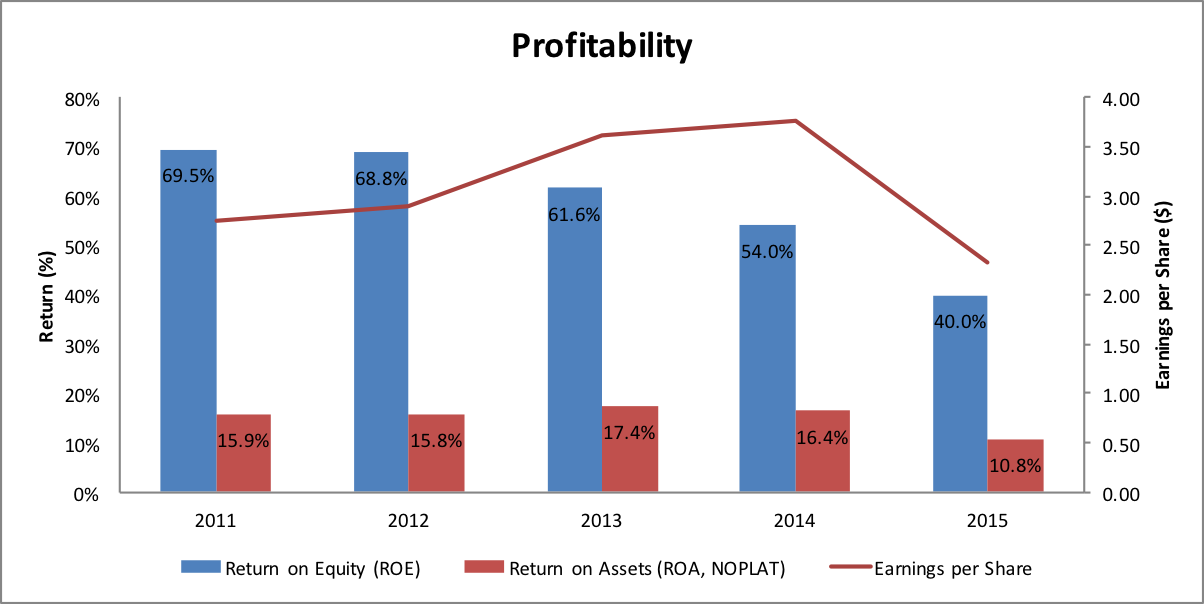
While the previous charts have expressed profitability as dollars earned per dollar of sales, the next chart looks at the profitability on the invested capital:
- The firm's Return on Assets (ROA) remains essentially unchanged during the first four years and only drops in 2015.
- In contrast, the firm's Return on Equity (ROE) has been declining more or less steadily since 2012. A closer look at the drivers of ROE reveals why (see table below).
- In 2013, asset turnover has slowed down a bit (from 1.45 to 1.41) and the equity ratio has increased from 21% to 26%. Therefore, despite the fact that the operating profitability has improved (Net income margin went up from 9.9% to 11.5%), ROE dropped from 69% to 62%.
- Similarly, in 2014, asset turnover kept slowing down and the equity ratio increased slightly. This brought about a further decrease in ROE, even though operating performance remained unchanged.
- Finally, in 2015, operating performance decreased. The effect on ROE was slightly counteracted by a smaller equity ratio. However, the overall effect was still negative.
|
ROE Decomposition |
2011 |
2012 |
2013 |
2014 |
2015 |
|
Net income margin |
10.3% |
9.9% |
11.5% |
11.4% |
6.9% |
|
Asset turnover |
1.40 |
1.45 |
1.41 |
1.35 |
1.35 |
|
Average equity ratio |
0.21 |
0.21 |
0.26 |
0.29 |
0.23 |
|
ROE |
69.5% |
68.8% |
61.6% |
54.0% |
40.0% |
PAYOUT
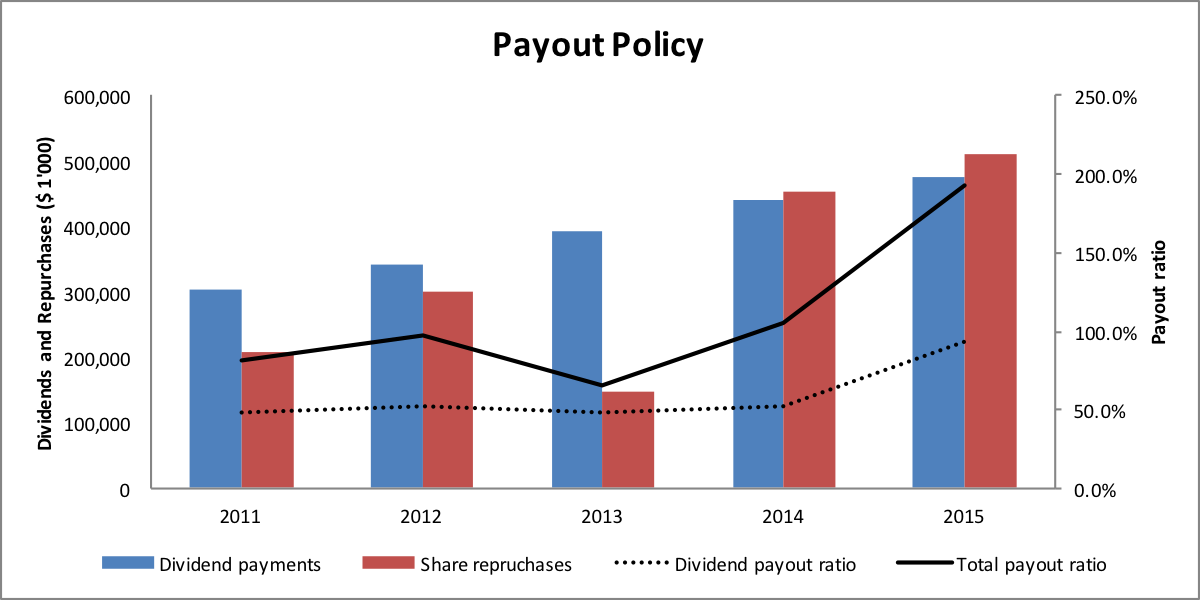
To summarize the firm's payout policy, we have looked at dividend payments and share repurchases:
- Dividend payments have increase steadily over the 5 years.
- With the exception of 2013, also share repurchases show a clear upside trend. Since 2014, share repurchases exceed dividend payments.
- In 2015, the total payout (dividends plus share repurchases) was approximately 1 billion. Given a net income of about 500 million, this corresponds to a total payout ratio of almost 200%!
- Therefore, the firm pays out more than it makes from operation. The gap was mainly financed with additional debt as well as the disposal of assets.
- In the long-run, a payout policy like the one in 2015 is not sustainable. It could be another indicator that the 2015 numbers are not fully representative given the impairment charges mentioned above.
VALUE CREATION
The last step of our journey was to look at the implications in terms of value creation. The key challenge there was to figure out whether the earnings the firm generates for its providers of capital is sufficient to cover the cost of capital.
We have used NOPLAT as a starting point because NOPLAT is the firm's net income free of financing effects. We have used NOPLAT in combination with the firm's invested capital to estimate the Return on Invested Capital (ROIC). This return we have compared to the return the providers of capital require, the so-called Weighted Average Cost of Capital (WACC).
The following chart summarizes these considerations for Hershey:
- The ROIC exceeds the WACC in each of the 5 years. Since profitability dropped considerably in 2015, that year also exhibits the lowest return spread.
- Still, with a return spread of 10%, Hershey appears to be a highly lucrative investment for its providers of capital.
- Expressed in dollars, the return spread translates into an Economic Value Added of 500 - 700 million in the first 4 years and 350 million in 2015.

These numbers raise an interesting question: If Hershey's investments add so much value, why is it that the firm does not invest more instead of returning all its profits (and more) to the shareholders? The answer could be as follows:
- Many firms have very profitable assets in place from previous investment activities.
- However, to replicate the original success, NEW investment projects need to be found. And these new projects need to offer comparable return opportunities.
- This turns out more complicated than it sounds. Most firms find it very hard to come up with "great new project."
- Absent good investment opportunities, firms should pay out the cash to their providers of capital.