Growth and Investment in the Steady State
This section discusses the crucial issue of how to assess the firm value created after the explicit forecast period.
2. Competitive Advantage Period Model
Clearly, not all firms will converge to a "normal" growth rate right after the years covered by the "explicit forecast period." Think, for example, of a pharmaceutical company that develops a new drug against cancer. For such a firm, the quality of the available data might only allow explicit forecasts for the years until (expected) FDA approval. This forecast period could then be followed by a period of exceptional growth, during which the firm markets its new drug and enjoys patent protection. For this period of exceptional growth, the model of a “growing perpetuity” is clearly not suitable:
· Because the firm enjoys a competitive advantage after the forecast period, growth can be substantially larger than expected GDP growth, which is the upper limit of the long-term growth rate when we model continuing value with a perpetuity.
· More importantly, however, the idea of a “perpetuity” with constant growth rate g is flawed. Eventually, the firm’s competitive advantage with the drug will disappear (for example, because patents expire or competitors discover alternative treatments) and it will need to find new ideas to generate real growth.
But how to value such a firm? The proposed solution is fairly simple: Instead of converting directly to a "steady state" after the forecast period, we insert an intermediary period during which the firm's cash flows experience exceptional growth. The resulting valuation model is the so-called Competitive Advantage Period (CAP) Model.
The CAP Model suggests the following simple three-step procedure:
- Forecast period: Value the cash flows during the forecast period of T years (the same way we did it in the previous section)
- Competitive Advantage Period: Make a simplifying assumption for the growth rate of the cash flows for N years after the explicit forecast period.
- Continuing Value: At the end of the CAP (after T + N years from now), assume that the firm will converge to a "steady state" with a normal growth rate.
Therefore, the only difference to the preceeding model is that we insert a CAP between the forecast period and continuing value. In some instances, it might even make sense to insert multiple CAPs before converging to the steady state.
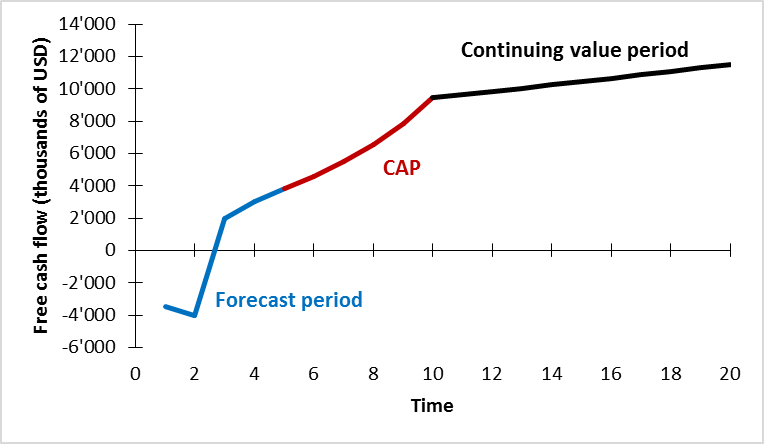
Let's look at the CAP Model with a numerical example. Suppose we have forecasted a firm's free cash flows for the following 4 years as summarized in the following table. During these years, the firm is expected to finalize product development and enter the market.
|
(thousands of USD) |
Year 1 |
Year 2 |
Year 3 |
Year 4 |
Year 5 |
|
Free Cash Flow |
-3'500 |
-4'000 |
2'000 |
3'000 |
3'800 |

- Valuation of the explicit forecast period
- Valuation of the CAP
- Valuation of the continuing value period.
This exercise is best carried out in a spreadsheet program. The corresponding file (Excel) can be downloaded here.
To value the explicit forecast period, we proceed as in all previous examples: We capitalize the projected free cash flows for the years 1 to 5 with the WACC of 10%:
PV Forecast Period = \( \frac{-3'500}{1.1} + \frac{-4'000}{1.1^2} + \frac{2'000}{1.1^3} + \frac{3'000}{1.1^4} + \frac{3'800} {1.1^5} \) = -576.
The firm value that arises from the forecast period is therefore -576 thousand.
Next, we turn to the CAP period. According to our assumptions, the free cash flows will grow at a constant rate of 20% after the explicit forecast period. Consequently, we can project the free cash flows for the years 6 to 10 as follows:
- \( FCF_6 = FCF_5 \times 1.2 = 3'800 \times 1.2 = 4'560 \)
- \( FCF_7 = FCF_5 \times 1.2^2 = 3'800 \times 1.2^2 = 5'472 \)
- ...
- \( FCF_{10} = FCF_5 \times 1.2^5 = 3'800 \times 1.2^5 = 9'456 \)
With this information, we can now estimate the present value of the free cash flows during the CAP:
PV CAP = \( \frac{4'560}{1.1^6} + \frac{5'472}{1.1^7} + ... + \frac{9'456} {1.1^10} \) = 15'433.
The firm value that arises from the CAP is therefore 15'433 thousand.
The last step is to estimate the firm's continuing value after year 10. We assume a perpetuity that grows with 2% per year. Consequently, the future value of continuing value (at the end of year 10) is:
Future value of continuing value = \( \frac{FCF_{10} \times (1+g)}{WACC - g} = \frac{9'456 \times 1.02}{0.1 - 0.02} \) = 120'559.
The present value of continuing value, therefore, is:
Present value of continuing value = \( \frac{Continuing \ space value_{10}}{(1+WACC)^{10}} = \frac{120'559}{1.1^{10}} \) = 46'481.
The firm value that arises from the continuing value is therefore 46'481 thousand.
These three steps provide us with an estimate of the value of the firm:
Firm value = PV Forecast period + PV CAP + PV Continuing value = -576 + 15'433 + 46'481 = 61'337.
Put differently, the cash flow projections we made imply a firm value of roughly 61 million. Note that roughly 75% of that value come from the continuing value period (after year 10).
This section has shown how to estimate the value of a firm that enters a competitive advantage period (CAP) after the explicit forecast period and only then converges to a steady state with a "normalized" growth rate.