Solution: Clean Water Discussion
1. The Base Case
The Excel file Clean Water Financial Plan contains a detailed solution of the management case. Let's look at some of the main takeaways.
Cash flow projections
- The operating business is projected to be fairly stable and very profitable. This is consistent with the firm's past. For example, in Year 2, the projections imply an EBIT of roughly 700'000. Given projected net revenues of roughly 3.4 million, this corresponds to a healthy EBIT margin of 20%.
- The exception is Year 1, where extraordinary restructuring charges lead to substantially lower profitability.
- Given the low capital intensity of the business, investment outlays are moderate. Therefore, the firm's free cash flows are also very stable and rather attractive. Looking at year 2, the numbers imply that for every EUR of net revenues, the firm generates a free cash flow of 16 cents.
- The following table summarizes the firm's operating and investment cash flows and derives the projected free cash flows:
Year 1
Year 2
Year 3
Year 4
Year 5
Year 6
Year 7
Year 8
Year 9
EBIT
318
698
722
757
804
861
871
880
890
- Adjusted taxes
67
147
152
159
169
181
183
185
187
NOPLAT
251
551
570
598
635
680
688
695
703
+ Depreciation
80
78
76
76
75
75
75
75
75
- Increase op. assets
-18
9
17
26
34
43
7
7
7
+ Increase op. liabilities
-87
4
8
11
15
19
3
3
3
Operating cash flow
262
624
637
659
691
731
759
766
774
- Net investments
100
75
75
75
75
75
75
75
75
Free cash flow
162
549
562
584
616
656
684
691
699
The buyer's cash needs
- Remember from before that the buyer will need substantial dividend payments from Clean Water to service the debt he has assumed to finance the purchase price. The question is whether the cash flows from the previous table will cover these cash needs. The answer is "not quite." The following table shows the debt payments the buyer will have to make (see the case intro for details):
Year 1
Year 2
Year 3
Year 4
Year 5
Year 6
Year 7
Year 8
Year 9
Total debt payments
110
610
600
590
580
570
560
540
520
- Interpretation:
- In Year 1, the firm is expected to generate a FCF of 162. The dividend requirements are 110. Hence, the firm should be able to pay the dividend and retain 52 [=162 - 110] as excess cash for future dividend payments.
- In Year 2, the FCF is 549 and the dividend is 610. Hence, the dividend exceeds the FCF by 61 [= 610 - 549]. Part of this liquidity gap can be bridged with the excess cash (52) from Year 1. To cover the remaining liquidity gap of 9 [=61 - 52], Clean Water will need to draw on its Revolving credit line. So the sources of funds for the dividend payment of 610 in Year 2 are:
- Free cash flow: 549
- Excess cash: 52
- Revolving credit: 9
- We proceed accordingly for the following years.
- The following table summarizes the full cash flow statement of Clean Water:
Year 1
Year 2
Year 3
Year 4
Year 5
Year 6
Year 7
Year 8
Year 9
EBIT
318
698
722
757
804
861
871
880
890
- Adjusted Taxes
67
147
152
159
169
181
183
185
187
NOPLAT
251
551
570
598
635
680
688
695
703
+ Depreciation
80
78
76
76
75
75
75
75
75
- Increase op. assets
-18
9
17
26
34
43
7
7
7
+ Increase op. liabilities
-87
4
8
11
15
19
3
3
3
Operating cash flow
262
624
637
659
691
731
759
766
774
- Investments
100
75
75
75
75
75
75
75
75
Free cash flow
162
549
562
584
616
656
684
691
699
- Interest exp. (after taxes)
0
0
0.4
2
3
1
0
0
0
- Repayment Revolver loan
0
0
9
47
55
22
0
0
0
+ New Revolver loan
0
9
47
55
22
0
0
0
0
Residual cash flow
162
558
600
590
580
634
684
691
699
+ New equity
0
0
0
0
0
0
0
0
0
- Net dividend
110
610
600
590
580
570
560
540
520
Change in cash
52
-52
0
0
0
64
124
151
179
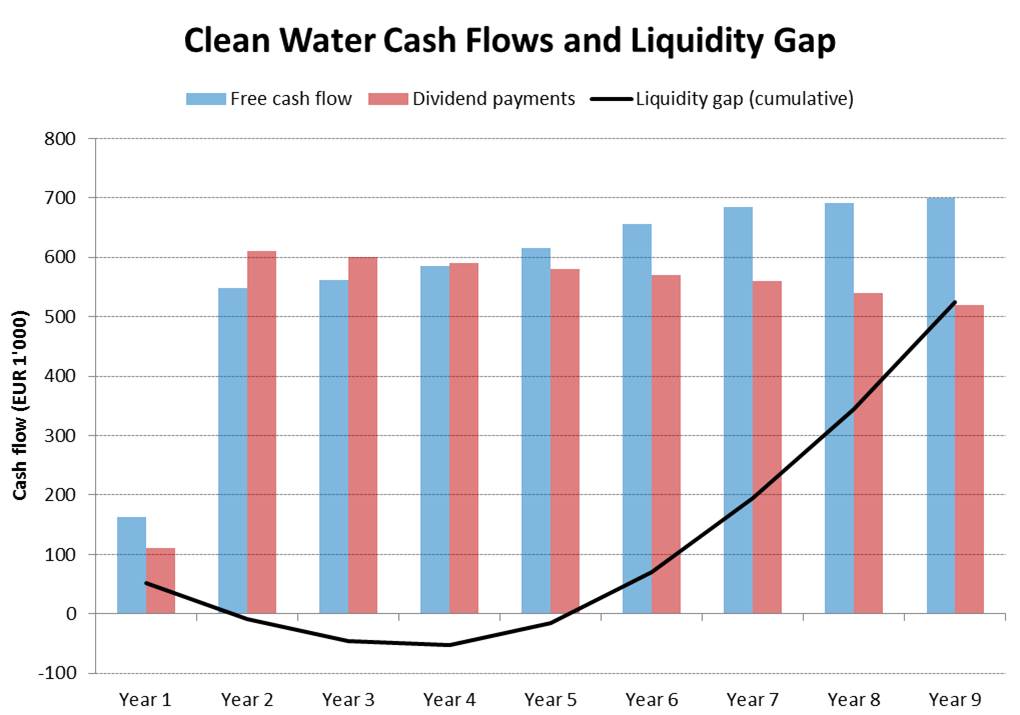
- As we can see, the firm will just be able to meet the owner's cash requirements. To do so, however, it will have to draw on its credit line.
- Given a credit line of 100'000, the numbers also show that there is very little margin of error. According to the financial plan, Clean Water will need to use 55'000 of that credit line in order ot survive. So the proposed financing structure really goes to the firm's limits.
- The following figure illustrates this graphically.

Next steps
Given that the proposed financing structure goes to the limits of what the business can support, the logical next step is to revisit some of the key assumptions. Are these assumptions realistic? How likely is it that the firm will be able to exceed the projections? What happens if it misses the projected values?
Let's look at two of the many additional analysis that one might want to conduct in such a situation: A zero-growth scenario and a scenario with less favorable revenue margins.