Reading: Financing Alternatives
3. Analyzing the Capital Structure
3.5. Summary
The previous pages have introduced the most popular ratios to analyze the capital structure of a company. While an individual ratio might not be very meaningful, we can use these numbers to make comparisons over time and/or across companies. This allows us to better understand where the company stands relative to its past and/or its peers. To illustrate, and to close this section, we look at Hershey's 5-year history and try to see how the firm's capital structure evolved during that time.
An Excel file that contains all these ratios, along with other key metrics for financial analysis, can be downloaded here.
LEVERAGE
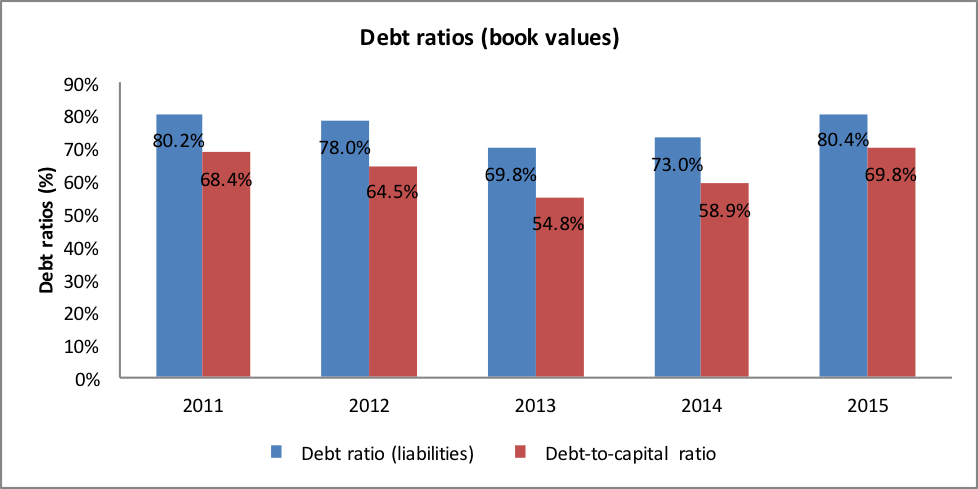
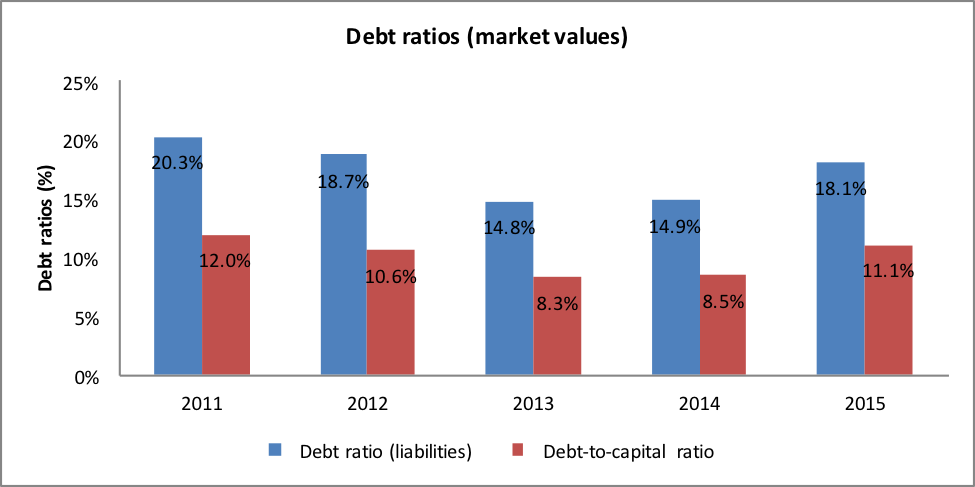
The following two charts summarize the debt ratios in terms of book values and market values, respectively:
- Looking at book values, liabilities account for approximately 80% of the whole balance sheet (debt ratio). When we exclude operating liabilities such as accounts payable, we see that debt accounts for approximately 70% of the firm's capital structure (debt-to-capital ratio).
- The debt ratios were at the same level back in 2011. In between, the have dropped by roughly 10 percentage points in 2013.
- The debt ratios appear fairly high. It would seem to be safe to assume that they will not increase substantially in the future.
- The picture looks different when we look at the ratios in market values. Because the market value of equity exceeds its book value substantially, the debt ratios reported in the second chart are much lower. In terms of market values, liabilities account for roughly 10% of total assets. When excluding operating liabilities, we find that debt makes up roughly 11% of the firm's capital.
- In terms of market values, the financial leverage does therefore not appear to be excessive.


COVERAGE RATIOS
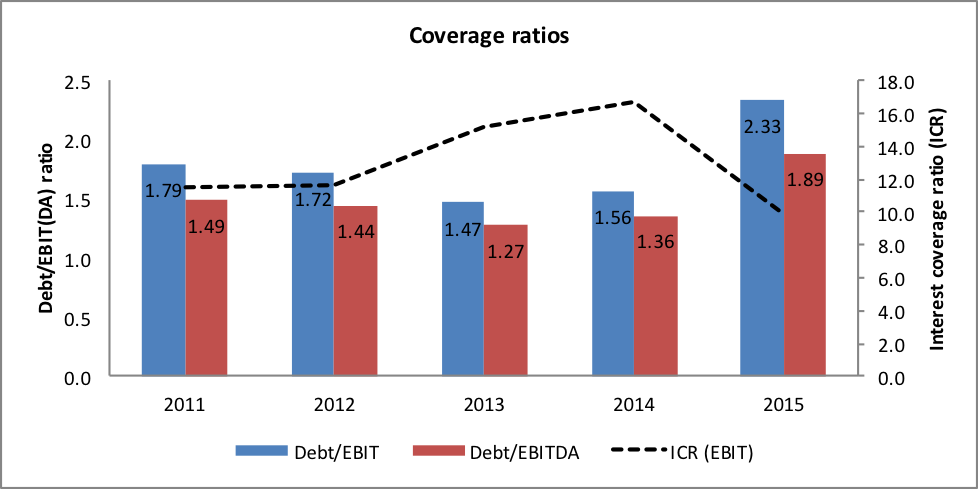
The next chart looks at coverage ratios. It shows to what extent the firm's operating profitability is able to cover the contractual debt obligations.
- While the ratios are fairly stable over the first four years, we see that the credit quality has somewhat deteriorated in the last year. The reason is that the firm's operating performance was less good than in previous years.
- Still, with an interest coverage ratio (ICR) of around 10 and a debt-to-ebit ratio of about 2, the firm's credit quality would seem to be fairly good.

ASSET COVERAGE RATIOS
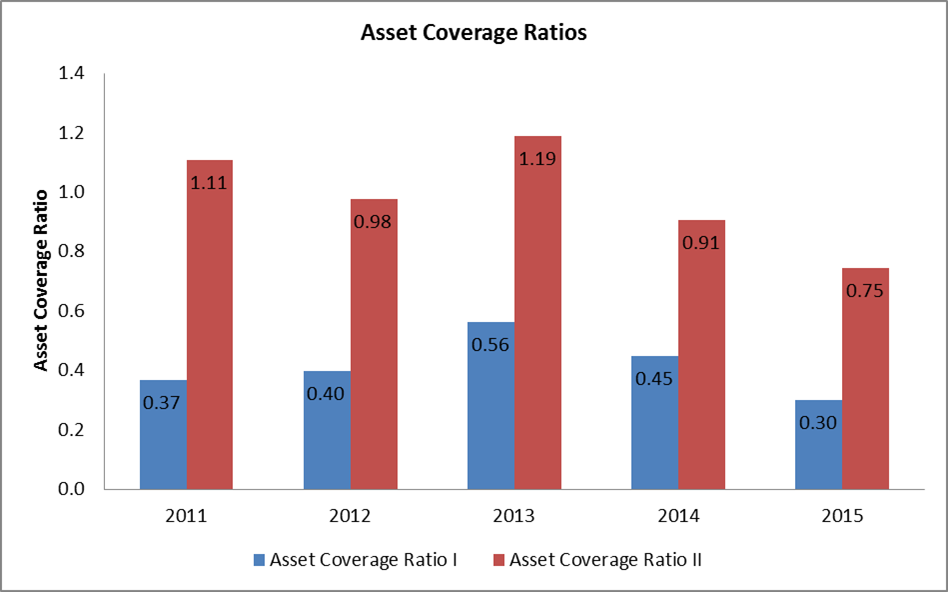
The last chart shows the firm's asset coverage ratios. The main observation here is that there seems to be a gradual decline in the asset coverate ratio II, i.e., the amount of long-term capital (long-term debt plus equity) that backs the firm's fixed assets. While this ratio was at or above 1 during the first three years, it dropped to 0.75 towards the end of the observation period.
